Supported by Dr. Osamu Ogasawara and  . . |
|
Last data update: 2014.03.03 |
Benderly and Zwick Data: Inflation, Growth and Stock ReturnsDescriptionTime series data, 1952–1982. Usagedata("BenderlyZwick")
FormatAn annual multiple time series from 1952 to 1982 with 5 variables.
SourceThe first three columns of the data are from Table 1 in Benderly and Zwick (1985). The remaining columns are taken from the online complements of Baltagi (2002). The first column is identical in both sources, the other two variables differ in their numeric values and additionally the growth series seems to be lagged differently. Baltagi (2002) states Lott and Ray (1992) as the source for his version of the data set. ReferencesBaltagi, B.H. (2002). Econometrics, 3rd ed. Berlin, Springer. Benderly, J., and Zwick, B. (1985). Inflation, Real Balances, Output and Real Stock Returns. American Economic Review, 75, 1115–1123. Lott, W.F., and Ray, S.C. (1992). Applied Econometrics: Problems with Data Sets. New York: The Dryden Press. Zaman, A., Rousseeuw, P.J., and Orhan, M. (2001). Econometric Applications of High-Breakdown Robust Regression Techniques. Economics Letters, 71, 1–8. See Also
Examples
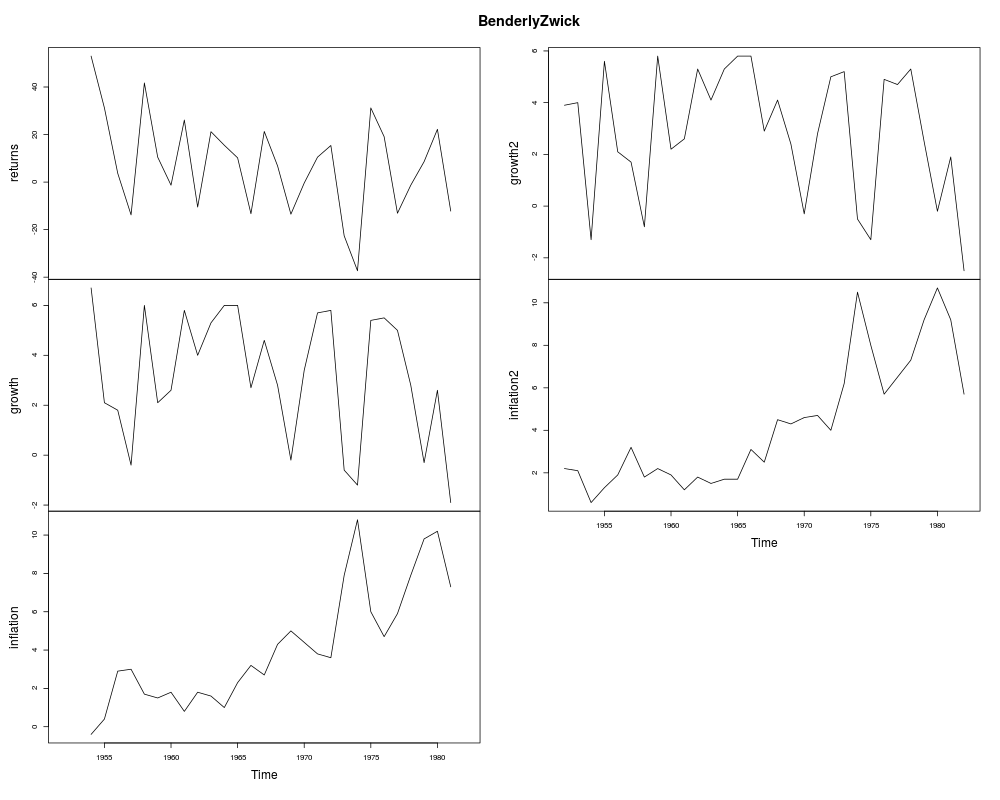
data("BenderlyZwick")
plot(BenderlyZwick)

## Benderly and Zwick (1985), p. 1116
library("dynlm")
bz_ols <- dynlm(returns ~ growth + inflation,
  data = BenderlyZwick/100, start = 1956, end = 1981)
summary(bz_ols)

## Zaman, Rousseeuw and Orhan (2001)
## use larger period, without scaling
bz_ols2 <- dynlm(returns ~ growth + inflation,
  data = BenderlyZwick, start = 1954, end = 1981)
summary(bz_ols2)
Results
R version 3.3.1 (2016-06-21) -- "Bug in Your Hair"
Copyright (C) 2016 The R Foundation for Statistical Computing
Platform: x86_64-pc-linux-gnu (64-bit)

R is free software and comes with ABSOLUTELY NO WARRANTY.
You are welcome to redistribute it under certain conditions.
Type 'license()' or 'licence()' for distribution details.

R is a collaborative project with many contributors.
Type 'contributors()' for more information and
'citation()' on how to cite R or R packages in publications.

Type 'demo()' for some demos, 'help()' for on-line help, or
'help.start()' for an HTML browser interface to help.
Type 'q()' to quit R.

> library(AER)
Loading required package: car
Loading required package: lmtest
Loading required package: zoo

Attaching package: 'zoo'

The following objects are masked from 'package:base':

    as.Date, as.Date.numeric

Loading required package: sandwich
Loading required package: survival
> png(filename="/home/ddbj/snapshot/RGM3/R_CC/result/AER/BenderlyZwick.Rd_%03d_medium.png", width=480, height=480)
> ### Name: BenderlyZwick
> ### Title: Benderly and Zwick Data: Inflation, Growth and Stock Returns
> ### Aliases: BenderlyZwick
> ### Keywords: datasets
>
> ### ** Examples
>
> data("BenderlyZwick")
> plot(BenderlyZwick)
>
> ## Benderly and Zwick (1985), p. 1116
> library("dynlm")
> bz_ols <- dynlm(returns ~ growth + inflation,
+   data = BenderlyZwick/100, start = 1956, end = 1981)
> summary(bz_ols)

Time series regression with "ts" data:
Start = 1956, End = 1981

Call:
dynlm(formula = returns ~ growth + inflation, data = BenderlyZwick/100,
    start = 1956, end = 1981)

Residuals:
      Min        1Q    Median        3Q       Max
-0.279553 -0.073666 -0.004526  0.085589  0.224095

Coefficients:
            Estimate Std. Error t value Pr(>|t|)
(Intercept)  -0.1238     0.0833  -1.486 0.150747
growth        5.2255     1.2702   4.114 0.000424 ***
inflation     0.1882     1.1053   0.170 0.866312
---
Signif. codes:  0 '***' 0.001 '**' 0.01 '*' 0.05 '.' 0.1 ' ' 1

Residual standard error: 0.1333 on 23 degrees of freedom
Multiple R-squared:  0.5119,	Adjusted R-squared:  0.4695
F-statistic: 12.06 on 2 and 23 DF,  p-value: 0.0002617

>
> ## Zaman, Rousseeuw and Orhan (2001)
> ## use larger period, without scaling
> bz_ols2 <- dynlm(returns ~ growth + inflation,
+   data = BenderlyZwick, start = 1954, end = 1981)
> summary(bz_ols2)

Time series regression with "ts" data:
Start = 1954, End = 1981

Call:
dynlm(formula = returns ~ growth + inflation, data = BenderlyZwick,
    start = 1954, end = 1981)

Residuals:
    Min      1Q  Median      3Q     Max
-27.235  -8.478  -0.848   6.322  25.171

Coefficients:
            Estimate Std. Error t value Pr(>|t|)
(Intercept)   -3.586      8.581  -0.418   0.6796
growth         4.778      1.368   3.492   0.0018 **
inflation     -1.046      1.145  -0.913   0.3698
---
Signif. codes:  0 '***' 0.001 '**' 0.01 '*' 0.05 '.' 0.1 ' ' 1

Residual standard error: 15.02 on 25 degrees of freedom
Multiple R-squared:  0.4961,	Adjusted R-squared:  0.4558
F-statistic: 12.31 on 2 and 25 DF,  p-value: 0.0001902

>
>
>
>
>
> dev.off()
null device
          1
>
|