Supported by Dr. Osamu Ogasawara and  . . |
|
Last data update: 2014.03.03 |
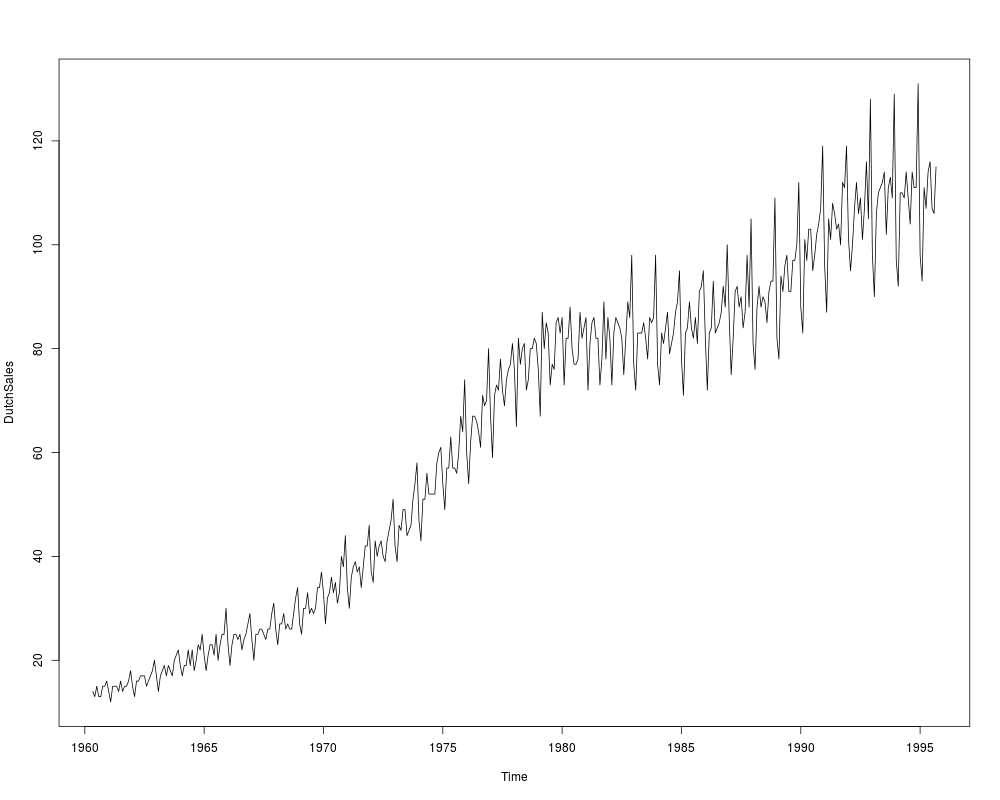
Dutch Retail Sales Index DataDescriptionTime series of retail sales index in The Netherlands. Usagedata("DutchSales")
FormatA monthly univariate time series from 1960(5) to 1995(9). SourceOnline complements to Franses (1998). http://www.few.eur.nl/few/people/franses/research/book2.htm ReferencesFranses, P.H. (1998). Time Series Models for Business and Economic Forecasting. Cambridge, UK: Cambridge University Press. See Also
Examples
data("DutchSales")
plot(DutchSales)

## EACF tables (Franses 1998, p. 99)
ctrafo <- function(x) residuals(lm(x ~ factor(cycle(x))))
ddiff <- function(x) diff(diff(x, frequency(x)), 1)
eacf <- function(y, lag = 12) {
  stopifnot(all(lag > 0))
  if(length(lag) < 2) lag <- 1:lag
  rval <- sapply(
    list(y = y, dy = diff(y), cdy = ctrafo(diff(y)),
         Dy = diff(y, frequency(y)), dDy = ddiff(y)),
    function(x) acf(x, plot = FALSE, lag.max = max(lag))$acf[lag + 1])
  rownames(rval) <- lag
  return(rval)
}

## Franses (1998), Table 5.3
round(eacf(log(DutchSales), lag = c(1:18, 24, 36)), digits = 3)
Results
R version 3.3.1 (2016-06-21) -- "Bug in Your Hair"
Copyright (C) 2016 The R Foundation for Statistical Computing
Platform: x86_64-pc-linux-gnu (64-bit)

R is free software and comes with ABSOLUTELY NO WARRANTY.
You are welcome to redistribute it under certain conditions.
Type 'license()' or 'licence()' for distribution details.

R is a collaborative project with many contributors.
Type 'contributors()' for more information and
'citation()' on how to cite R or R packages in publications.

Type 'demo()' for some demos, 'help()' for on-line help, or
'help.start()' for an HTML browser interface to help.
Type 'q()' to quit R.

> library(AER)
Loading required package: car
Loading required package: lmtest
Loading required package: zoo

Attaching package: 'zoo'

The following objects are masked from 'package:base':

    as.Date, as.Date.numeric

Loading required package: sandwich
Loading required package: survival
> png(filename="/home/ddbj/snapshot/RGM3/R_CC/result/AER/DutchSales.Rd_%03d_medium.png", width=480, height=480)
> ### Name: DutchSales
> ### Title: Dutch Retail Sales Index Data
> ### Aliases: DutchSales
> ### Keywords: datasets
>
> ### ** Examples
>
> data("DutchSales")
> plot(DutchSales)
>
> ## EACF tables (Franses 1998, p. 99)
> ctrafo <- function(x) residuals(lm(x ~ factor(cycle(x))))
> ddiff <- function(x) diff(diff(x, frequency(x)), 1)
> eacf <- function(y, lag = 12) {
+   stopifnot(all(lag > 0))
+   if(length(lag) < 2) lag <- 1:lag
+   rval <- sapply(
+     list(y = y, dy = diff(y), cdy = ctrafo(diff(y)),
+          Dy = diff(y, frequency(y)), dDy = ddiff(y)),
+     function(x) acf(x, plot = FALSE, lag.max = max(lag))$acf[lag + 1])
+   rownames(rval) <- lag
+   return(rval)
+ }
>
> ## Franses (1998), Table 5.3
> round(eacf(log(DutchSales), lag = c(1:18, 24, 36)), digits = 3)
       y     dy    cdy    Dy    dDy
1  0.980 -0.264 -0.556 0.456 -0.532
2  0.967 -0.238 -0.024 0.490 -0.121
3  0.961 -0.004  0.221 0.654  0.307
4  0.954 -0.256 -0.180 0.486 -0.200
5  0.954  0.163  0.010 0.534 -0.011
6  0.950  0.236  0.160 0.593  0.148
7  0.940  0.093 -0.150 0.492 -0.093
8  0.929 -0.195 -0.025 0.492 -0.106
9  0.922 -0.004  0.223 0.607  0.268
10 0.912 -0.306 -0.256 0.431 -0.276
11 0.913 -0.098 -0.035 0.556  0.228
12 0.916  0.816  0.453 0.432 -0.061
13 0.897 -0.248 -0.497 0.375 -0.290
14 0.885 -0.113  0.344 0.633  0.408
15 0.877 -0.112 -0.125 0.446 -0.119
16 0.870 -0.238 -0.109 0.392 -0.189
17 0.870  0.218  0.176 0.540  0.240
18 0.865  0.181 -0.008 0.429 -0.045
24 0.827  0.656 -0.007 0.300 -0.308
36 0.738  0.593 -0.125 0.210 -0.312
>
>
>
>
>
> dev.off()
null device
          1
>
|
Created & Maintained by Osamu Ogasawara (osamu.ogasawara@gmail.com) and 