Supported by Dr. Osamu Ogasawara and  . . |
|
Last data update: 2014.03.03 |
More Guns, Less Crime?DescriptionGuns is a balanced panel of data on 50 US states, plus the District of Columbia (for a total of 51 states), by year for 1977–1999. Usagedata("Guns")
FormatA data frame containing 1,173 observations on 13 variables.
DetailsEach observation is a given state in a given year. There are a total of 51 states times 23 years = 1,173 observations. SourceOnline complements to Stock and Watson (2007). http://wps.aw.com/aw_stock_ie_2/0,12040,3332253-,00.html ReferencesAyres, I., and Donohue, J.J. (2003). Shooting Down the ‘More Guns Less Crime’ Hypothesis. Stanford Law Review, 55, 1193–1312. Stock, J.H. and Watson, M.W. (2007). Introduction to Econometrics, 2nd ed. Boston: Addison Wesley. See Also
Examples
## data
data("Guns")
## visualization
library("lattice")
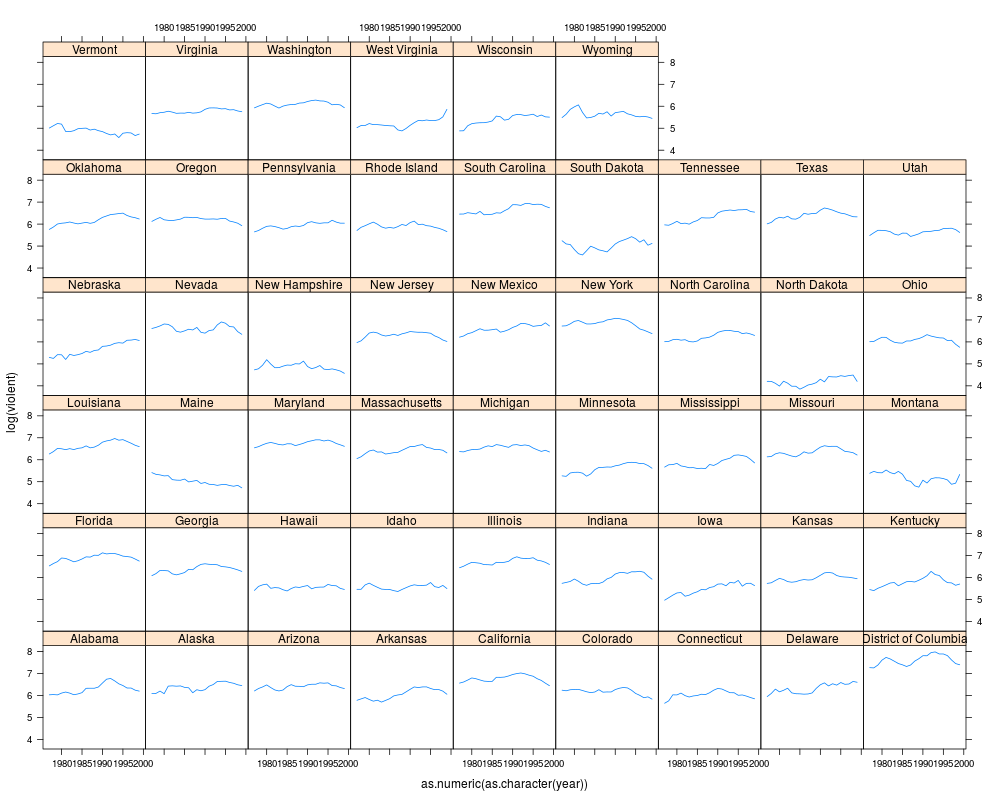
xyplot(log(violent) ~ as.numeric(as.character(year)) | state, data = Guns, type = "l")
## Stock & Watson (2007), Empirical Exercise 10.1, pp. 376--377
fm1 <- lm(log(violent) ~ law, data = Guns)
coeftest(fm1, vcov = sandwich)
fm2 <- lm(log(violent) ~ law + prisoners + density + income +
population + afam + cauc + male, data = Guns)
coeftest(fm2, vcov = sandwich)
fm3 <- lm(log(violent) ~ law + prisoners + density + income +
population + afam + cauc + male + state, data = Guns)
printCoefmat(coeftest(fm3, vcov = sandwich)[1:9,])
fm4 <- lm(log(violent) ~ law + prisoners + density + income +
population + afam + cauc + male + state + year, data = Guns)
printCoefmat(coeftest(fm4, vcov = sandwich)[1:9,])
Results
R version 3.3.1 (2016-06-21) -- "Bug in Your Hair"
Copyright (C) 2016 The R Foundation for Statistical Computing
Platform: x86_64-pc-linux-gnu (64-bit)

R is free software and comes with ABSOLUTELY NO WARRANTY.
You are welcome to redistribute it under certain conditions.
Type 'license()' or 'licence()' for distribution details.

R is a collaborative project with many contributors.
Type 'contributors()' for more information and
'citation()' on how to cite R or R packages in publications.

Type 'demo()' for some demos, 'help()' for on-line help, or
'help.start()' for an HTML browser interface to help.
Type 'q()' to quit R.

> library(AER)
Loading required package: car
Loading required package: lmtest
Loading required package: zoo

Attaching package: 'zoo'

The following objects are masked from 'package:base':

    as.Date, as.Date.numeric

Loading required package: sandwich
Loading required package: survival
> png(filename="/home/ddbj/snapshot/RGM3/R_CC/result/AER/Guns.Rd_%03d_medium.png", width=480, height=480)
> ### Name: Guns
> ### Title: More Guns, Less Crime?
> ### Aliases: Guns
> ### Keywords: datasets
>
> ### ** Examples
>
> ## data
> data("Guns")
>
> ## visualization
> library("lattice")
> xyplot(log(violent) ~ as.numeric(as.character(year)) | state, data = Guns, type = "l")
>
> ## Stock & Watson (2007), Empirical Exercise 10.1, pp. 376--377
> fm1 <- lm(log(violent) ~ law, data = Guns)
> coeftest(fm1, vcov = sandwich)

t test of coefficients:

             Estimate Std. Error t value  Pr(>|t|)
(Intercept)  6.134919   0.019287 318.078 < 2.2e-16 ***
lawyes      -0.442965   0.047488  -9.328 < 2.2e-16 ***
---
Signif. codes:  0 '***' 0.001 '**' 0.01 '*' 0.05 '.' 0.1 ' ' 1

>
> fm2 <- lm(log(violent) ~ law + prisoners + density + income +
+   population + afam + cauc + male, data = Guns)
> coeftest(fm2, vcov = sandwich)

t test of coefficients:

               Estimate  Std. Error  t value  Pr(>|t|)
(Intercept)  2.9817e+00  6.0668e-01   4.9149 1.016e-06 ***
lawyes      -3.6839e-01  3.4654e-02 -10.6304 < 2.2e-16 ***
prisoners    1.6126e-03  1.8000e-04   8.9591 < 2.2e-16 ***
density      2.6688e-02  1.4294e-02   1.8671  0.062142 .
income       1.2051e-06  7.2498e-06   0.1662  0.868007
population   4.2710e-02  3.1345e-03  13.6255 < 2.2e-16 ***
afam         8.0853e-02  1.9916e-02   4.0598 5.241e-05 ***
cauc         3.1200e-02  9.6897e-03   3.2200  0.001317 **
male         8.8709e-03  1.2014e-02   0.7384  0.460435
---
Signif. codes:  0 '***' 0.001 '**' 0.01 '*' 0.05 '.' 0.1 ' ' 1

>
> fm3 <- lm(log(violent) ~ law + prisoners + density + income +
+   population + afam + cauc + male + state, data = Guns)
> printCoefmat(coeftest(fm3, vcov = sandwich)[1:9,])
               Estimate  Std. Error t value  Pr(>|t|)
(Intercept)  4.0368e+00  3.7479e-01 10.7708 < 2.2e-16 ***
lawyes      -4.6141e-02  1.9435e-02 -2.3741   0.01776 *
prisoners   -7.1008e-05  9.4831e-05 -0.7488   0.45414
density     -1.7229e-01  1.0221e-01 -1.6857   0.09213 .
income      -9.2037e-06  6.5619e-06 -1.4026   0.16102
population   1.1525e-02  9.4572e-03  1.2186   0.22325
afam         1.0428e-01  1.6133e-02  6.4636 1.526e-10 ***
cauc         4.0861e-02  5.2487e-03  7.7850 1.585e-14 ***
male        -5.0273e-02  7.5923e-03 -6.6215 5.518e-11 ***
---
Signif. codes:  0 '***' 0.001 '**' 0.01 '*' 0.05 '.' 0.1 ' ' 1
>
> fm4 <- lm(log(violent) ~ law + prisoners + density + income +
+   population + afam + cauc + male + state + year, data = Guns)
> printCoefmat(coeftest(fm4, vcov = sandwich)[1:9,])
               Estimate  Std. Error t value  Pr(>|t|)
(Intercept)  3.9720e+00  4.3322e-01  9.1685 < 2.2e-16 ***
lawyes      -2.7994e-02  1.8692e-02 -1.4976    0.1345
prisoners    7.5994e-05  8.0008e-05  0.9498    0.3424
density     -9.1555e-02  6.2588e-02 -1.4628    0.1438
income       9.5859e-07  6.9440e-06  0.1380    0.8902
population  -4.7545e-03  6.4673e-03 -0.7351    0.4624
afam         2.9186e-02  2.0298e-02  1.4379    0.1507
cauc         9.2500e-03  8.2188e-03  1.1255    0.2606
male         7.3326e-02  1.8116e-02  4.0475 5.542e-05 ***
---
Signif. codes:  0 '***' 0.001 '**' 0.01 '*' 0.05 '.' 0.1 ' ' 1
>
>
>
>
>
> dev.off()
null device
          1
>
|