Supported by Dr. Osamu Ogasawara and  . . |
|
Last data update: 2014.03.03 |
Parade Magazine 2005 Earnings DataDescriptionUS earnings data, as provided in an annual survey of Parade (here from 2005), the Sunday newspaper magazine supplementing the Sunday (or Weekend) edition of many daily newspapers in the USA. Usagedata("Parade2005")
FormatA data frame containing 130 observations on 5 variables.
DetailsIn addition to the four variables provided by Parade (earnings, age, gender, and state), a fifth variable was introduced, the “celebrity factor” (here actors, athletes, TV personalities, politicians, and CEOs are considered celebrities). The data are quite far from a simple random sample, there being substantial oversampling of celebrities. SourceParade (2005). What People Earn. Issue March 13, 2005. Examples
## data
data("Parade2005")
attach(Parade2005)
summary(Parade2005)
## bivariate visualizations
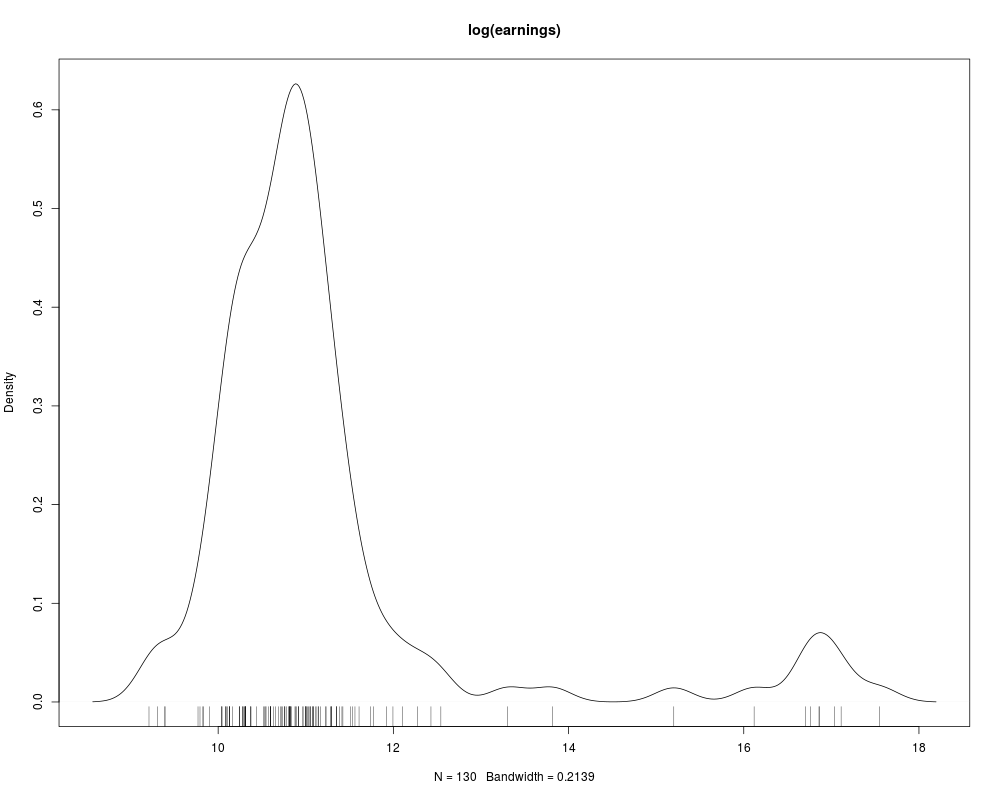
plot(density(log(earnings), bw = "SJ"), type = "l", main = "log(earnings)")
rug(log(earnings))
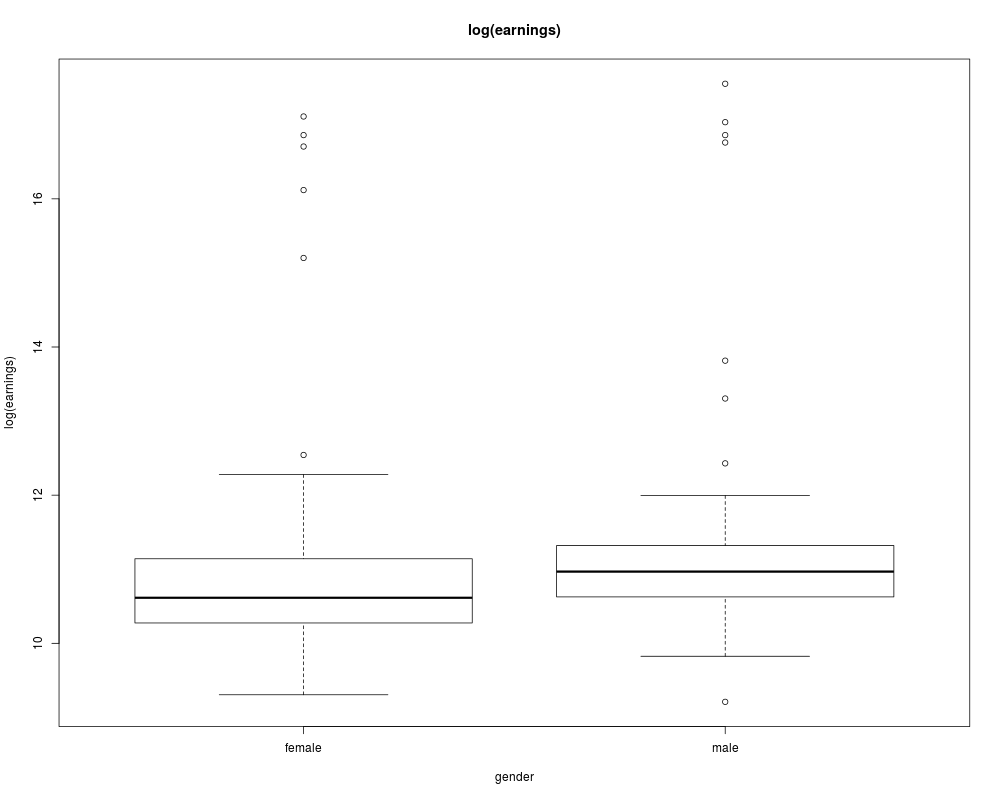
plot(log(earnings) ~ gender, main = "log(earnings)")
## celebrity vs. non-celebrity earnings
noncel <- subset(Parade2005, celebrity == "no")
cel <- subset(Parade2005, celebrity == "yes")
library("ineq")
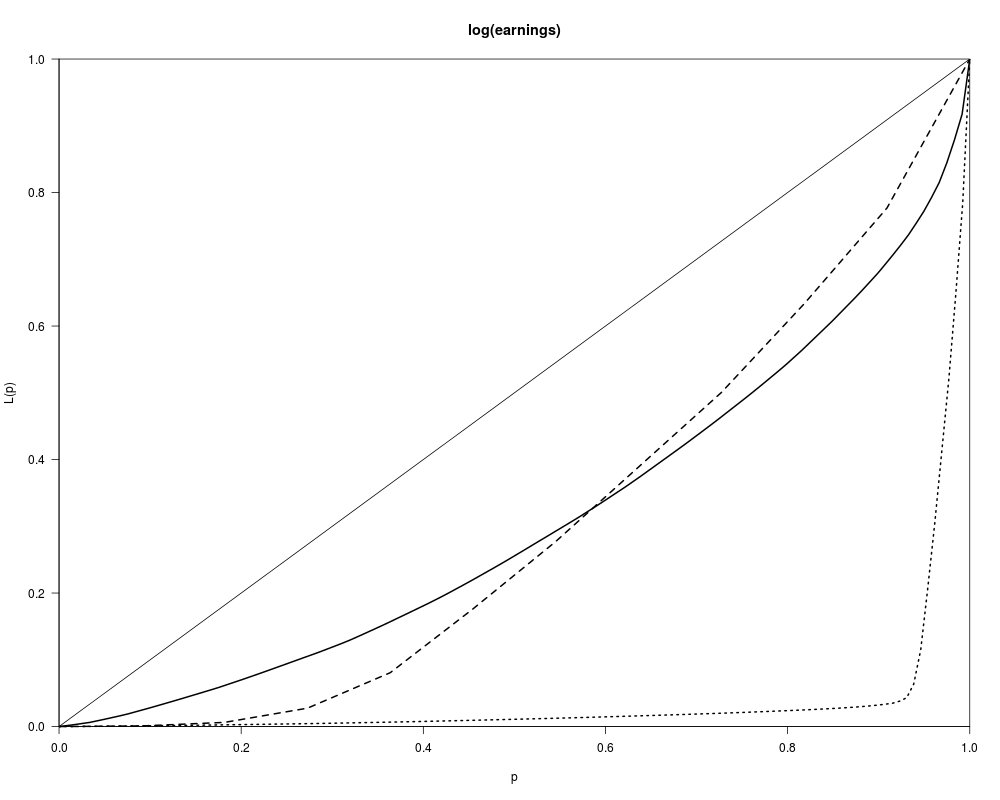
plot(Lc(noncel$earnings), main = "log(earnings)")
lines(Lc(cel$earnings), lty = 2)
lines(Lc(earnings), lty = 3)
Gini(noncel$earnings)
Gini(cel$earnings)
Gini(earnings)
## detach data
detach(Parade2005)
Results
R version 3.3.1 (2016-06-21) -- "Bug in Your Hair"
Copyright (C) 2016 The R Foundation for Statistical Computing
Platform: x86_64-pc-linux-gnu (64-bit)

R is free software and comes with ABSOLUTELY NO WARRANTY.
You are welcome to redistribute it under certain conditions.
Type 'license()' or 'licence()' for distribution details.

R is a collaborative project with many contributors.
Type 'contributors()' for more information and
'citation()' on how to cite R or R packages in publications.

Type 'demo()' for some demos, 'help()' for on-line help, or
'help.start()' for an HTML browser interface to help.
Type 'q()' to quit R.

> library(AER)
Loading required package: car
Loading required package: lmtest
Loading required package: zoo

Attaching package: 'zoo'

The following objects are masked from 'package:base':

    as.Date, as.Date.numeric

Loading required package: sandwich
Loading required package: survival
> png(filename="/home/ddbj/snapshot/RGM3/R_CC/result/AER/Parade2005.Rd_%03d_medium.png", width=480, height=480)
> ### Name: Parade2005
> ### Title: Parade Magazine 2005 Earnings Data
> ### Aliases: Parade2005
> ### Keywords: datasets
>
> ### ** Examples
>
> ## data
> data("Parade2005")
> attach(Parade2005)
> summary(Parade2005)
    earnings             age           gender       state    celebrity
 Min.   :   10000   Min.   :18.00   female:62   CA     :10   no :119
 1st Qu.:   30000   1st Qu.:30.25   male  :68   ID     : 5   yes: 11
 Median :   50000   Median :38.50               IN     : 5
 Mean   : 1503412   Mean   :39.18               VA     : 5
 3rd Qu.:   78575   3rd Qu.:47.00               FL     : 4
 Max.   :42000000   Max.   :64.00               IL     : 4
                                                (Other):97
>
> ## bivariate visualizations
> plot(density(log(earnings), bw = "SJ"), type = "l", main = "log(earnings)")
> rug(log(earnings))
> plot(log(earnings) ~ gender, main = "log(earnings)")
>
> ## celebrity vs. non-celebrity earnings
> noncel <- subset(Parade2005, celebrity == "no")
> cel <- subset(Parade2005, celebrity == "yes")
>
> library("ineq")
> plot(Lc(noncel$earnings), main = "log(earnings)")
> lines(Lc(cel$earnings), lty = 2)
> lines(Lc(earnings), lty = 3)
>
> Gini(noncel$earnings)
[1] 0.3814012
> Gini(cel$earnings)
[1] 0.38754
> Gini(earnings)
[1] 0.9228179
>
> ## detach data
> detach(Parade2005)
>
>
>
>
>
> dev.off()
null device
          1
>
|