Supported by Dr. Osamu Ogasawara and  . . |
|
Last data update: 2014.03.03 |
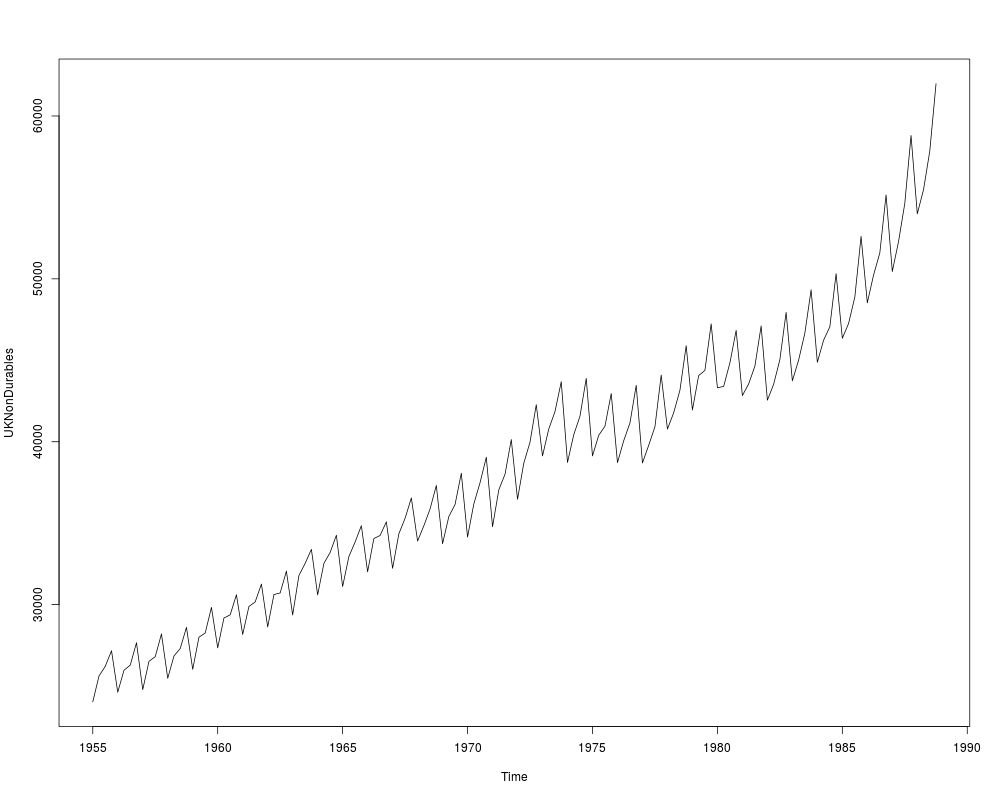
Consumption of Non-Durables in the UKDescriptionTime series of consumption of non-durables in the UK (in 1985 prices). Usagedata("UKNonDurables")
FormatA quarterly univariate time series from 1955(1) to 1988(4). SourceOnline complements to Franses (1998). http://www.few.eur.nl/few/people/franses/research/book2.htm ReferencesOsborn, D.R. (1988). A Survey of Seasonality in UK Macroeconomic Variables. International Journal of Forecasting, 6, 327–336. Franses, P.H. (1998). Time Series Models for Business and Economic Forecasting. Cambridge, UK: Cambridge University Press. See Also
Examples
data("UKNonDurables")
plot(UKNonDurables)

## EACF tables (Franses 1998, p. 99)
ctrafo <- function(x) residuals(lm(x ~ factor(cycle(x))))
ddiff <- function(x) diff(diff(x, frequency(x)), 1)
eacf <- function(y, lag = 12) {
  stopifnot(all(lag > 0))
  if(length(lag) < 2) lag <- 1:lag
  rval <- sapply(
    list(y = y, dy = diff(y), cdy = ctrafo(diff(y)),
         Dy = diff(y, frequency(y)), dDy = ddiff(y)),
    function(x) acf(x, plot = FALSE, lag.max = max(lag))$acf[lag + 1])
  rownames(rval) <- lag
  return(rval)
}

## Franses (1998), Table 5.2
round(eacf(log(UKNonDurables)), digits = 3)

## Franses (1998), Equation 5.51
## (Franses: sma1 = -0.632 (0.069))
arima(log(UKNonDurables), c(0, 1, 0), c(0, 1, 1))
Results
R version 3.3.1 (2016-06-21) -- "Bug in Your Hair"
Copyright (C) 2016 The R Foundation for Statistical Computing
Platform: x86_64-pc-linux-gnu (64-bit)

R is free software and comes with ABSOLUTELY NO WARRANTY.
You are welcome to redistribute it under certain conditions.
Type 'license()' or 'licence()' for distribution details.

R is a collaborative project with many contributors.
Type 'contributors()' for more information and
'citation()' on how to cite R or R packages in publications.

Type 'demo()' for some demos, 'help()' for on-line help, or
'help.start()' for an HTML browser interface to help.
Type 'q()' to quit R.

> library(AER)
Loading required package: car
Loading required package: lmtest
Loading required package: zoo

Attaching package: 'zoo'

The following objects are masked from 'package:base':

    as.Date, as.Date.numeric

Loading required package: sandwich
Loading required package: survival
> png(filename="/home/ddbj/snapshot/RGM3/R_CC/result/AER/UKNonDurables.Rd_%03d_medium.png", width=480, height=480)
> ### Name: UKNonDurables
> ### Title: Consumption of Non-Durables in the UK
> ### Aliases: UKNonDurables
> ### Keywords: datasets
>
> ### ** Examples
>
> data("UKNonDurables")
> plot(UKNonDurables)
>
> ## EACF tables (Franses 1998, p. 99)
> ctrafo <- function(x) residuals(lm(x ~ factor(cycle(x))))
> ddiff <- function(x) diff(diff(x, frequency(x)), 1)
> eacf <- function(y, lag = 12) {
+   stopifnot(all(lag > 0))
+   if(length(lag) < 2) lag <- 1:lag
+   rval <- sapply(
+     list(y = y, dy = diff(y), cdy = ctrafo(diff(y)),
+          Dy = diff(y, frequency(y)), dDy = ddiff(y)),
+     function(x) acf(x, plot = FALSE, lag.max = max(lag))$acf[lag + 1])
+   rownames(rval) <- lag
+   return(rval)
+ }
>
> ## Franses (1998), Table 5.2
> round(eacf(log(UKNonDurables)), digits = 3)
       y     dy    cdy     Dy    dDy
1  0.928 -0.463 -0.074  0.779 -0.164
2  0.900 -0.014 -0.359  0.625  0.050
3  0.876 -0.481 -0.034  0.449  0.048
4  0.891  0.947  0.554  0.248 -0.444
5  0.823 -0.438  0.023  0.238  0.236
6  0.795 -0.014 -0.390  0.130 -0.118
7  0.771 -0.471 -0.045  0.082  0.115
8  0.788  0.910  0.491 -0.014  0.023
9  0.723 -0.421 -0.081 -0.125 -0.251
10 0.697 -0.014 -0.328 -0.133  0.122
11 0.674 -0.464 -0.148 -0.196 -0.131
12 0.691  0.877  0.414 -0.196 -0.001
>
> ## Franses (1998), Equation 5.51
> ## (Franses: sma1 = -0.632 (0.069))
> arima(log(UKNonDurables), c(0, 1, 0), c(0, 1, 1))

Call:
arima(x = log(UKNonDurables), order = c(0, 1, 0), seasonal = c(0, 1, 1))

Coefficients:
         sma1
      -0.6095
s.e.   0.0711

sigma^2 estimated as 0.0001234:  log likelihood = 402.71,  aic = -801.42
>
>
>
>
>
> dev.off()
null device
          1
>
|
Created & Maintained by Osamu Ogasawara (osamu.ogasawara@gmail.com) and 