Supported by Dr. Osamu Ogasawara and  . . |
|
Last data update: 2014.03.03 |
Heatmap for data with variables of mixed typesDescriptionProduces a heatmap visualizing all samples and variables of a dataset. Both samples and variables are clustered using methods suitable for mixed-type data. Different types of variables are indicated by different color schemes. Usage
mix.heatmap(data, D.subjects, D.variables, dend.subjects, dend.variables, varweights,
dist.variables.method = c("associationMeasures", "ClustOfVar"),
associationFun = association, rowlab, rowmar = 3, lab.cex = 1.5,
ColSideColors, RowSideColors,
col.cont = marray::maPalette(low = "lightblue", high = "darkblue", k = 50),
col.ord = list(low = "lightgreen", high = "darkgreen"),
col.cat = c("indianred1","darkred","orangered","orange","palevioletred1",
          "violetred4","red3","indianred4"),
legend.colbar, legend.rowbar, legend.mat = FALSE, legend.cex = 1)
Arguments
DetailsIf no dendrograms or distance matrices are given, subjects and/or samples are clustered with methods for mixed-type data. Similarities between subjects are measured by Gower's general similarity coefficient with an extension of Podani for ordinal variables, see Variables are shown as rows of the heatmap, samples as columns. ValueA mixed-data heatmap with dendrograms and annotation NoteThe heatmap is currently limited to 200 variables = columns of Author(s)Manuela Hummel, m.hummel@dkfz.de ReferencesGower J (1971). A general coefficient of similarity and some of its properties. Biometrics, 27:857-871. Chavent M, Kuentz-Simonet V, Liquet B, Saracco J (2012). ClustOfVar: An R Package for the Clustering of Variables. Journal of Statistical Software, 50:1-16. See Also
Examples
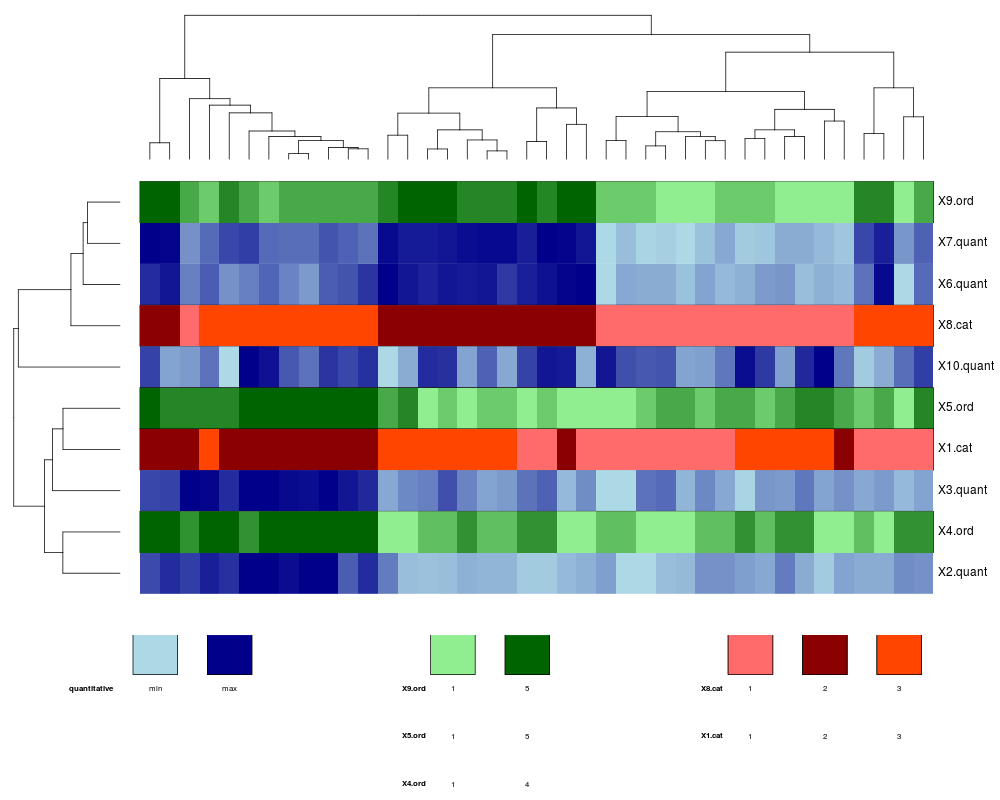
data(mixdata)
mix.heatmap(mixdata, rowmar=7, legend.mat=TRUE)
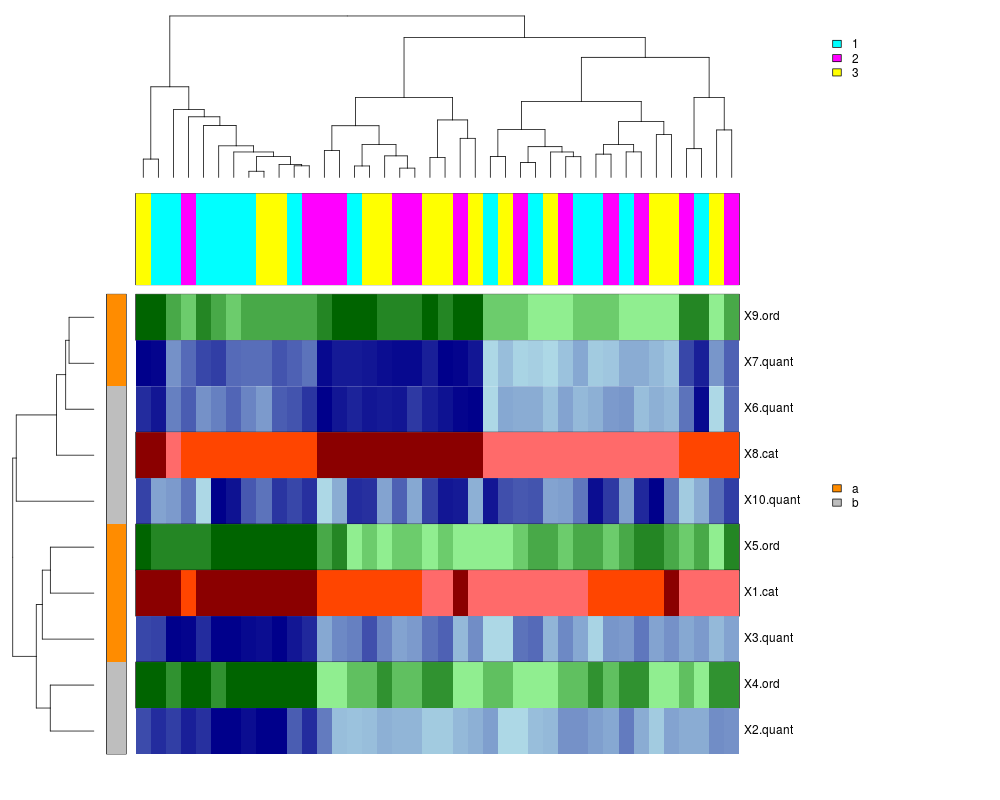
## with (random) color bars
colbar <- rep(5:7, nrow(mixdata))
rowbar <- rep(c("darkorange","grey"), ncol(mixdata))
mix.heatmap(mixdata, ColSideColors=colbar, RowSideColors=rowbar,
legend.colbar=c("1","2","3"), legend.rowbar=c("a","b"), rowmar=7)
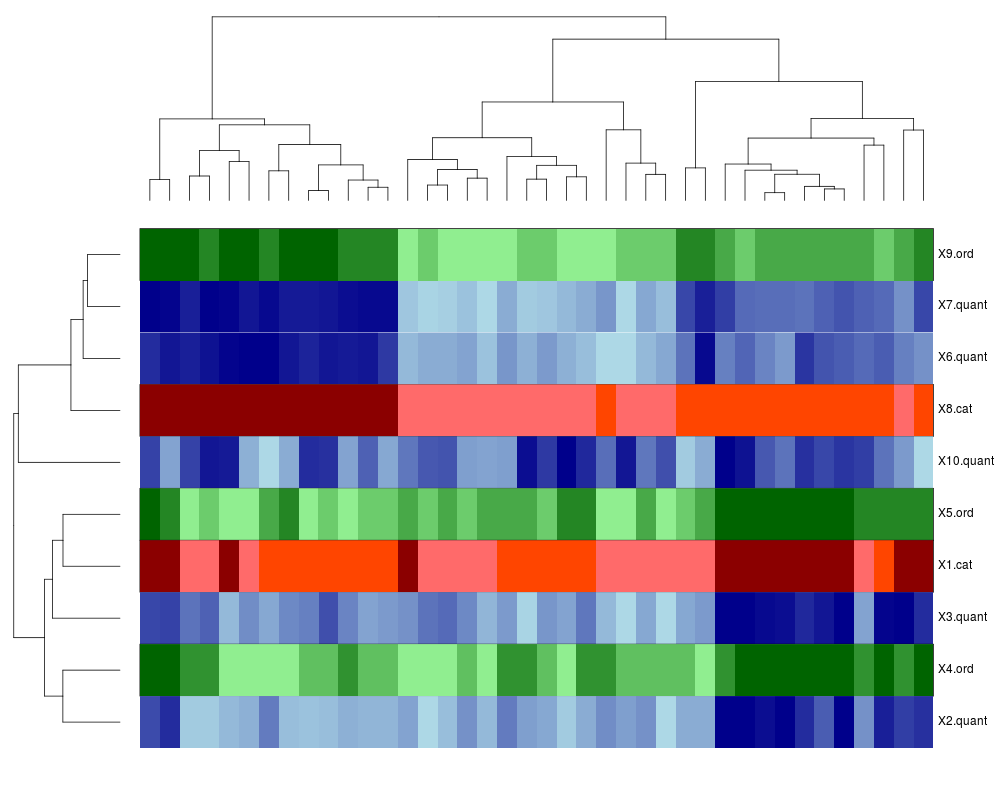
## example with variable weights
w <- rep(1:2, each=5)
mix.heatmap(mixdata, varweights=w, rowmar=7)
Results
R version 3.3.1 (2016-06-21) -- "Bug in Your Hair"
Copyright (C) 2016 The R Foundation for Statistical Computing
Platform: x86_64-pc-linux-gnu (64-bit)

R is free software and comes with ABSOLUTELY NO WARRANTY.
You are welcome to redistribute it under certain conditions.
Type 'license()' or 'licence()' for distribution details.

R is a collaborative project with many contributors.
Type 'contributors()' for more information and
'citation()' on how to cite R or R packages in publications.

Type 'demo()' for some demos, 'help()' for on-line help, or
'help.start()' for an HTML browser interface to help.
Type 'q()' to quit R.

> library(CluMix)
> png(filename="/home/ddbj/snapshot/RGM3/R_CC/result/CluMix/mix.heatmap.Rd_%03d_medium.png", width=480, height=480)
> ### Name: mix.heatmap
> ### Title: Heatmap for data with variables of mixed types
> ### Aliases: mix.heatmap
> ### Keywords: hplot
>
> ### ** Examples
>
> data(mixdata)
>
> mix.heatmap(mixdata, rowmar=7, legend.mat=TRUE)
>
> ## with (random) color bars
> colbar <- rep(5:7, nrow(mixdata))
> rowbar <- rep(c("darkorange","grey"), ncol(mixdata))
> mix.heatmap(mixdata, ColSideColors=colbar, RowSideColors=rowbar,
+ legend.colbar=c("1","2","3"), legend.rowbar=c("a","b"), rowmar=7)
>
> ## example with variable weights
> w <- rep(1:2, each=5)
> mix.heatmap(mixdata, varweights=w, rowmar=7)
>
>
>
>
>
> dev.off()
null device
          1
>
|