Supported by Dr. Osamu Ogasawara and  . . |
|
Last data update: 2014.03.03 |
Generate Bootstrap Replicates of Whittermore's StatisticDescriptionGenerate bootstrap replicates of Whittermore's statistic by means of function boot from boot library. Notice that these functions should not be used separately but as argument statistic when calling function boot. whittermore.boot is used to perform a non-parametric bootstrap whittermore.pboot is used when using parametric bootstrap. Usagewhittermore.boot(data, i, ...) whittermore.pboot(...) Arguments
ValueBoth functions return the value of the statistic. ReferencesWhittermore, A. S. and Friend, N. and Byron, W. and Brown, J. R. and Holly, E. A. (1987). A test to detect clusters of disease. Biometrika 74, 631-635. See AlsoDCluster, boot, whittermore, whittermore.stat Examples
library(boot)
library(spdep)
data(nc.sids)
sids<-data.frame(Observed=nc.sids$SID74)
sids<-cbind(sids, Expected=nc.sids$BIR74*sum(nc.sids$SID74)/sum(nc.sids$BIR74) )
sids<-cbind(sids, x=nc.sids$x, y=nc.sids$y)
#Calculate neighbours based on distance
coords<-as.matrix(sids[,c("x", "y")])
dlist<-dnearneigh(coords, 0, Inf)
dlist<-include.self(dlist)
dlist.d<-nbdists(dlist, coords)
#Calculate weights. They are globally standardised but it doesn't
#change significance.
col.W.whitt<-nb2listw(dlist, glist=dlist.d, style="C")
niter<-100
#Permutation model
wt.boot<-boot(sids, statistic=whittermore.boot, R=niter, listw=col.W.whitt,
zero.policy=TRUE)
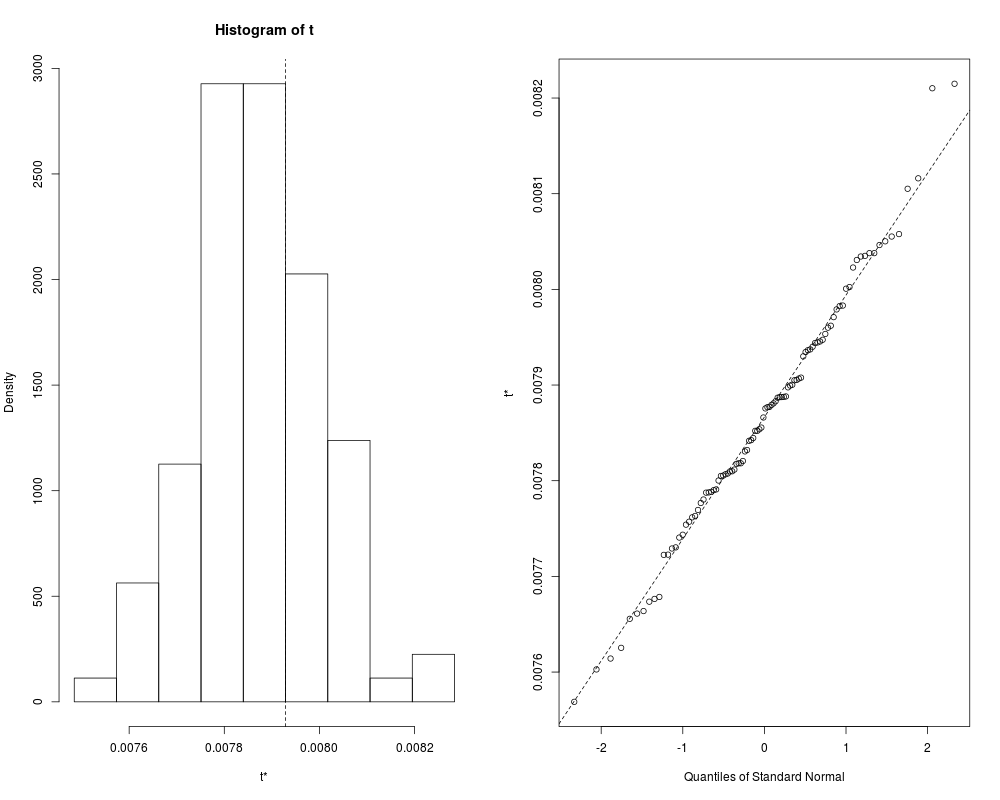
plot(wt.boot)#Display results
#Multinomial model
wt.mboot<-boot(sids, statistic=whittermore.pboot, sim="parametric",
ran.gen=multinom.sim, R=niter, listw=col.W.whitt, zero.policy=TRUE)
plot(wt.mboot)#Display results
#Poisson model
wt.pboot<-boot(sids, statistic=whittermore.pboot, sim="parametric",
ran.gen=poisson.sim, R=niter, listw=col.W.whitt, zero.policy=TRUE)
plot(wt.pboot)#Display results
#Poisson-Gamma model
wt.pgboot<-boot(sids, statistic=whittermore.pboot, sim="parametric",
ran.gen=negbin.sim, R=niter, listw=col.W.whitt, zero.policy=TRUE)
plot(wt.pgboot)#Display results
Results
R version 3.3.1 (2016-06-21) -- "Bug in Your Hair"
Copyright (C) 2016 The R Foundation for Statistical Computing
Platform: x86_64-pc-linux-gnu (64-bit)

R is free software and comes with ABSOLUTELY NO WARRANTY.
You are welcome to redistribute it under certain conditions.
Type 'license()' or 'licence()' for distribution details.

R is a collaborative project with many contributors.
Type 'contributors()' for more information and
'citation()' on how to cite R or R packages in publications.

Type 'demo()' for some demos, 'help()' for on-line help, or
'help.start()' for an HTML browser interface to help.
Type 'q()' to quit R.

> library(DCluster)
Loading required package: boot
Loading required package: spdep
Loading required package: sp
Loading required package: Matrix
Loading required package: MASS
> png(filename="/home/ddbj/snapshot/RGM3/R_CC/result/DCluster/whittermore.boot.Rd_%03d_medium.png", width=480, height=480)
> ### Name: whittermore.boot
> ### Title: Generate Bootstrap Replicates of Whittermore's Statistic
> ### Aliases: whittermore.boot whittermore.pboot
> ### Keywords: spatial
>
> ### ** Examples
>
> library(boot)
> library(spdep)
>
> data(nc.sids)
>
> sids<-data.frame(Observed=nc.sids$SID74)
> sids<-cbind(sids, Expected=nc.sids$BIR74*sum(nc.sids$SID74)/sum(nc.sids$BIR74) )
> sids<-cbind(sids, x=nc.sids$x, y=nc.sids$y)
>
> #Calculate neighbours based on distance
> coords<-as.matrix(sids[,c("x", "y")])
>
> dlist<-dnearneigh(coords, 0, Inf)
> dlist<-include.self(dlist)
> dlist.d<-nbdists(dlist, coords)
>
> #Calculate weights. They are globally standardised but it doesn't
> #change significance.
> col.W.whitt<-nb2listw(dlist, glist=dlist.d, style="C")
>
> niter<-100
>
> #Permutation model
> wt.boot<-boot(sids, statistic=whittermore.boot, R=niter, listw=col.W.whitt,
+ 	zero.policy=TRUE)
> plot(wt.boot)#Display results
>
> #Multinomial model
> wt.mboot<-boot(sids, statistic=whittermore.pboot, sim="parametric",
+ 	ran.gen=multinom.sim,  R=niter,  listw=col.W.whitt, zero.policy=TRUE)
>
> plot(wt.mboot)#Display results
>
> #Poisson model
> wt.pboot<-boot(sids, statistic=whittermore.pboot, sim="parametric",
+ 	ran.gen=poisson.sim,  R=niter,  listw=col.W.whitt, zero.policy=TRUE)
>
> plot(wt.pboot)#Display results
>
> #Poisson-Gamma model
> wt.pgboot<-boot(sids, statistic=whittermore.pboot, sim="parametric",
+ 	ran.gen=negbin.sim, R=niter, listw=col.W.whitt, zero.policy=TRUE)
> plot(wt.pgboot)#Display results
>
>
>
>
>
> dev.off()
null device
          1
>
|