Supported by Dr. Osamu Ogasawara and  . . |
|
Last data update: 2014.03.03 |
Area Under the CurveDescriptionCalculate the area under the curve with a naive algorithm and with a more elaborated spline approach. The curve must be given by vectors of xy-coordinates. Usage
AUC(x, y, method = c("trapezoid", "step", "spline"), na.rm = FALSE)
Arguments
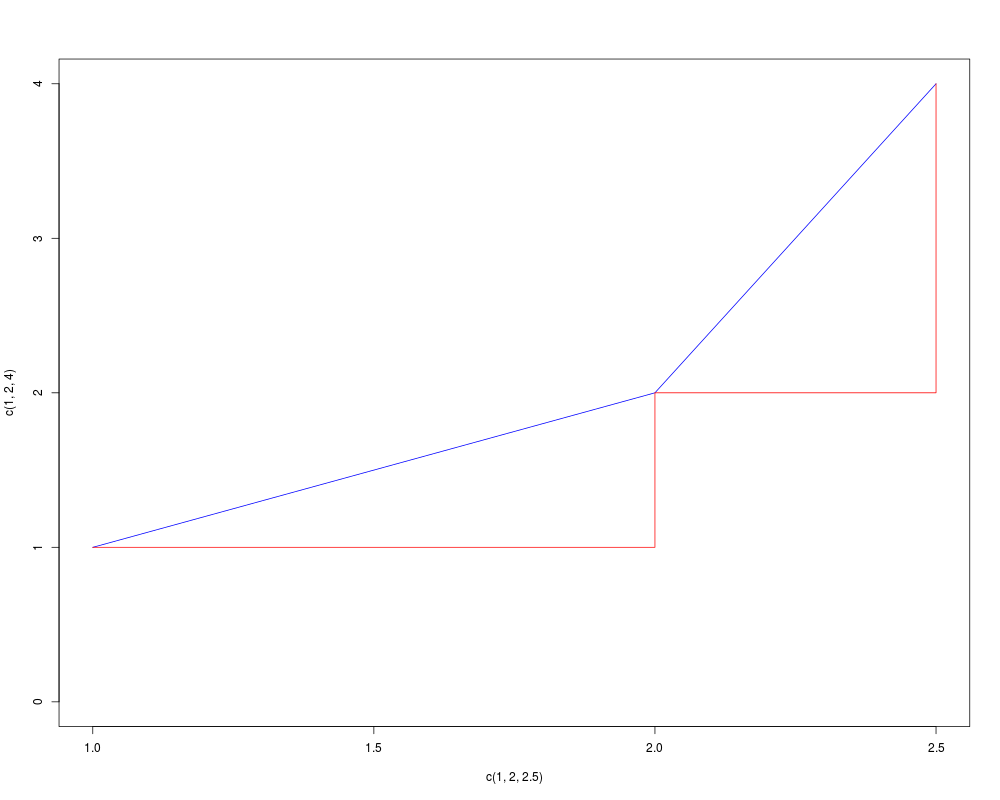
DetailsIf method is set to "trapezoid" then the curve is formed by connecting all points by a direct line (composite trapezoid rule). If "step" is chosen then a stepwise connection of two points is used.
For calculating the area under a spline interpolation the ValueNumeric value of the area under the curve. Author(s)Andri Signorell <andri@signorell.net>, spline part by Claus Ekstrom <claus@rprimer.dk> See Also
ExamplesAUC(x=c(1,3), y=c(1,1)) AUC(x=c(1,2,3), y=c(1,2,4), method="trapezoid") AUC(x=c(1,2,3), y=c(1,2,4), method="step") plot(x=c(1,2,2.5), y=c(1,2,4), type="l", col="blue", ylim=c(0,4)) lines(x=c(1,2,2.5), y=c(1,2,4), type="s", col="red") x <- seq(0, pi, length.out=200) AUC(x=x, y=sin(x)) AUC(x=x, y=sin(x), method="spline") Results
R version 3.3.1 (2016-06-21) -- "Bug in Your Hair"
Copyright (C) 2016 The R Foundation for Statistical Computing
Platform: x86_64-pc-linux-gnu (64-bit)

R is free software and comes with ABSOLUTELY NO WARRANTY.
You are welcome to redistribute it under certain conditions.
Type 'license()' or 'licence()' for distribution details.

R is a collaborative project with many contributors.
Type 'contributors()' for more information and
'citation()' on how to cite R or R packages in publications.

Type 'demo()' for some demos, 'help()' for on-line help, or
'help.start()' for an HTML browser interface to help.
Type 'q()' to quit R.

> library(DescTools)
> png(filename="/home/ddbj/snapshot/RGM3/R_CC/result/DescTools/AUC.Rd_%03d_medium.png", width=480, height=480)
> ### Name: AUC
> ### Title: Area Under the Curve
> ### Aliases: AUC
> ### Keywords: math
>
> ### ** Examples
>
> AUC(x=c(1,3), y=c(1,1))
[1] 2
>
> AUC(x=c(1,2,3), y=c(1,2,4), method="trapezoid")
[1] 4.5
> AUC(x=c(1,2,3), y=c(1,2,4), method="step")
[1] 3
>
> plot(x=c(1,2,2.5), y=c(1,2,4), type="l", col="blue", ylim=c(0,4))
> lines(x=c(1,2,2.5), y=c(1,2,4), type="s", col="red")
>
> x <- seq(0, pi, length.out=200)
> AUC(x=x, y=sin(x))
[1] 1.999958
> AUC(x=x, y=sin(x), method="spline")
[1] 2
>
>
>
>
>
> dev.off()
null device
          1
>
|