Supported by Dr. Osamu Ogasawara and  . . |
|
Last data update: 2014.03.03 |
Barnard's Unconditional TestDescriptionBarnard's unconditional test for superiority applied to 2x2 contingency tables using Score or Wald statistics for the difference between two binomial proportions. Usage
BarnardTest(x, y = NULL, alternative = c("two.sided", "less", "greater"),
            dp = 0.001, pooled = TRUE)
Arguments
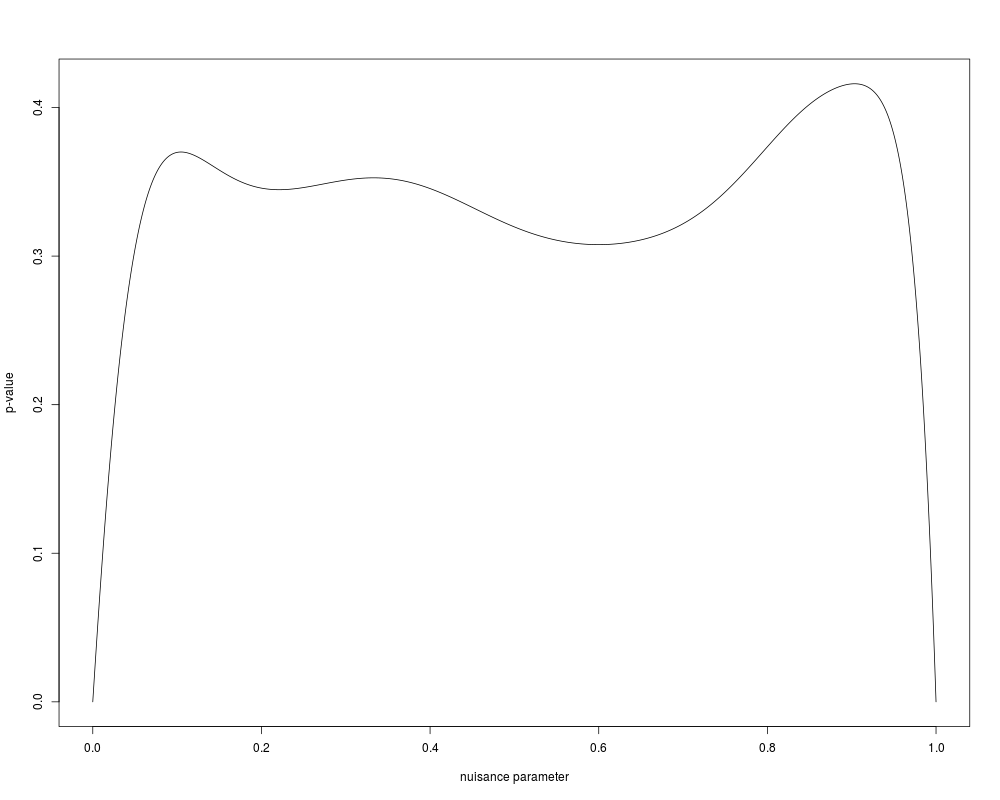
DetailsIf For a 2x2 contingency table, such as X=[n_1,n_2;n_3,n_4], the normalized difference in proportions between the two categories, given in each column, can be written with pooled variance (Score statistic) as T(X)=frac{hat{p}_2-hat{p}_1}{√{hat{p}(1-hat{p})(frac{1}{c_1}+frac{1}{c_2})}}, where hat{p}=(n_1+n_3)/(n_1+n_2+n_3+n_4), hat{p}_2=n_2/(n_2+n_4), hat{p}_1=n_1/(n_1+n_3), c_1=n_1+n_3 and c_2=n_2+n_4. Alternatively, with unpooled variance (Wald statistic), the difference in proportions can we written as T(X)=frac{hat{p}_2-hat{p}_1}{√{frac{hat{p}_1(1-hat{p}_1)}{c_1}+frac{hat{p}_2(1-hat{p}_2)}{c_2}}}. The probability of observing X is P(X)=frac{c_1!c_2!}{n_1!n_2!n_3!n_4!}p^{n_1+n_2}(1-p)^{n_3+n_4}, where p is the unknown nuisance parameter. Barnard's test considers all tables with category sizes c_1 and c_2 for a given p. The p-value is the sum of probabilities of the tables having a score in the rejection region, e.g. having significantly large difference in proportions for a two-sided test. The p-value of the test is the maximum p-value calculated over all p between 0 and 1. ValueA list with class
Author(s)Kamil Erguler, <k.erguler@cyi.ac.cy>, Peter Calhoun <calhoun.peter@gmail.com>, Rodrigo Duprat, Andri Signorell <andri@signorell.net> (interface) ReferencesBarnard, G.A. (1945) A new test for 2x2 tables. Nature, 156:177. Barnard, G.A. (1947) Significance tests for 2x2 tables. Biometrika, 34:123-138. Suissa, S. and Shuster, J. J. (1985), Exact Unconditional Sample Sizes for the 2x2 Binomial Trial, Journal of the Royal Statistical Society, Ser. A, 148, 317-327. Cardillo G. (2009) MyBarnard: a very compact routine for Barnard's exact test on 2x2 matrix. http://www.mathworks.com/matlabcentral/fileexchange/25760 Galili T. (2010) http://www.r-statistics.com/2010/02/barnards-exact-test-a-powerful-alternative-for-fishers-exact-test-implemented-in-r/ Lin C.Y., Yang M.C. (2009) Improved p-value tests for comparing two independent binomial proportions. Communications in Statistics-Simulation and Computation, 38(1):78-91. Trujillo-Ortiz, A., R. Hernandez-Walls, A. Castro-Perez, L. Rodriguez-Cardozo N.A. Ramos-Delgado and R. Garcia-Sanchez. (2004). Barnardextest:Barnard's Exact Probability Test. A MATLAB file. [WWW document]. http://www.mathworks.com/ See Also
Examples
tab <- as.table(matrix(c(8, 14, 1, 3), nrow=2,
dimnames=list(treat=c("I","II"), out=c("I","II"))))
BarnardTest(tab)
# Plotting the search for the nuisance parameter for a one-sided test
bt <- BarnardTest(tab)
plot(bt$nuisance.matrix[, 1:2],
t="l", xlab="nuisance parameter", ylab="p-value")
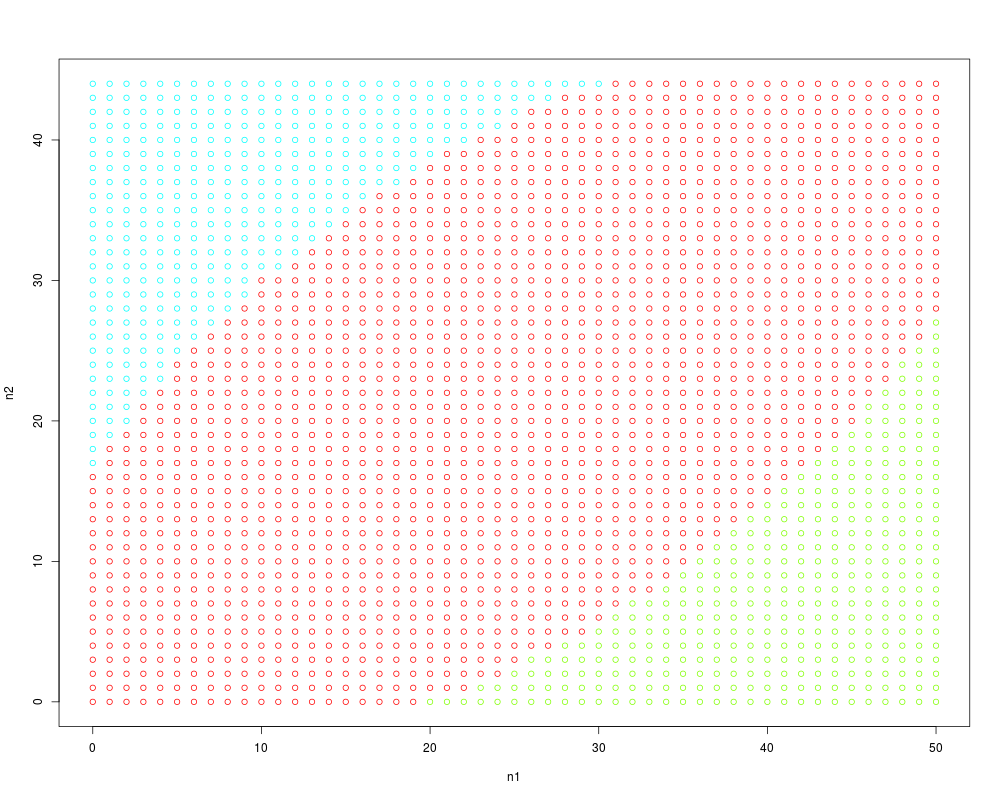
# Plotting the tables included in the p-value
ttab <- as.table(matrix(c(40, 14, 10, 30), nrow=2,
dimnames=list(treat=c("I","II"), out=c("I","II"))))
bt <- BarnardTest(ttab)
bts <- bt$statistic.table
plot(bts[, 1], bts[, 2],
col=hsv(bts[, 4] / 4, 1, 1),
t="p", xlab="n1", ylab="n2")
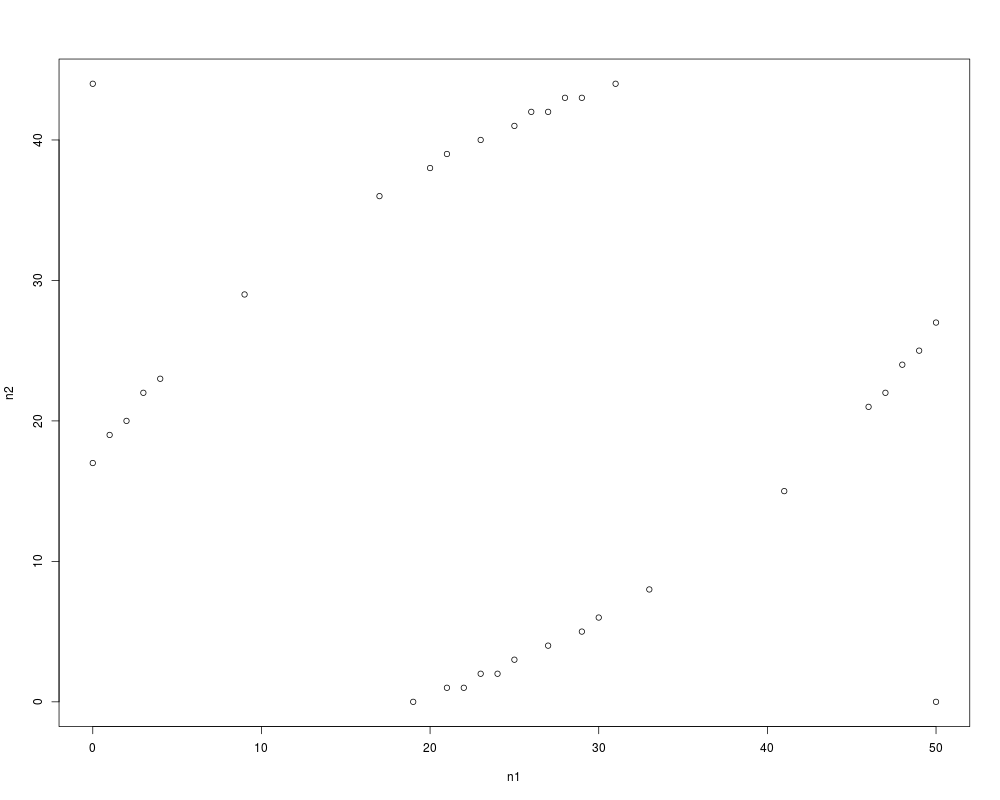
# Plotting the difference between pooled and unpooled tests
bts <- BarnardTest(ttab, pooled=TRUE)$statistic.table
btw <- BarnardTest(ttab, pooled=FALSE)$statistic.table
plot(bts[, 1], bts[, 2],
col=c("black", "white")[1 + as.numeric(bts[, 4]==btw[, 4])],
t="p", xlab="n1", ylab="n2")
Results
R version 3.3.1 (2016-06-21) -- "Bug in Your Hair"
Copyright (C) 2016 The R Foundation for Statistical Computing
Platform: x86_64-pc-linux-gnu (64-bit)

R is free software and comes with ABSOLUTELY NO WARRANTY.
You are welcome to redistribute it under certain conditions.
Type 'license()' or 'licence()' for distribution details.

R is a collaborative project with many contributors.
Type 'contributors()' for more information and
'citation()' on how to cite R or R packages in publications.

Type 'demo()' for some demos, 'help()' for on-line help, or
'help.start()' for an HTML browser interface to help.
Type 'q()' to quit R.

> library(DescTools)
> png(filename="/home/ddbj/snapshot/RGM3/R_CC/result/DescTools/BarnardTest.Rd_%03d_medium.png", width=480, height=480)
> ### Name: BarnardTest
> ### Title: Barnard's Unconditional Test
> ### Aliases: BarnardTest
> ### Keywords: nonparametric htest
>
> ### ** Examples
>
> tab <- as.table(matrix(c(8, 14, 1, 3), nrow=2,
+                 dimnames=list(treat=c("I","II"), out=c("I","II"))))
> BarnardTest(tab)

	Barnards Unconditional 2x2-test

data:  tab
Score statistic = -0.43944, p-value = 0.7858
alternative hypothesis: two.sided
sample estimates:
Nuisance parameter
             0.102

>
> # Plotting the search for the nuisance parameter for a one-sided test
> bt <- BarnardTest(tab)
> plot(bt$nuisance.matrix[, 1:2],
+      t="l", xlab="nuisance parameter", ylab="p-value")
>
> # Plotting the tables included in the p-value
> ttab <- as.table(matrix(c(40, 14, 10, 30), nrow=2,
+                  dimnames=list(treat=c("I","II"), out=c("I","II"))))
>
> bt <- BarnardTest(ttab)
> bts <- bt$statistic.table
> plot(bts[, 1], bts[, 2],
+      col=hsv(bts[, 4] / 4, 1, 1),
+      t="p", xlab="n1", ylab="n2")
>
> # Plotting the difference between pooled and unpooled tests
> bts <- BarnardTest(ttab, pooled=TRUE)$statistic.table
> btw <- BarnardTest(ttab, pooled=FALSE)$statistic.table
> plot(bts[, 1], bts[, 2],
+      col=c("black", "white")[1 + as.numeric(bts[, 4]==btw[, 4])],
+      t="p", xlab="n1", ylab="n2")
>
>
>
>
>
> dev.off()
null device
          1
>
|