Supported by Dr. Osamu Ogasawara and  . . |
|
Last data update: 2014.03.03 |
Bartels Rank TestDescriptionPerforms the Bartels rank test of randomness. Usage
BartelsRankTest(x, alternative = c("two.sided", "trend", "oscillation"),
                method = c("normal", "beta", "auto"))
Arguments
DetailsMissing values are removed. The RVN test statistic is RVN=∑(R_i-R_{i+1})^2 / ∑(R_i-(n+1)/2)^2 where R_i=rank(X_i), i=1,...,n. It is known that (RVN-2)/σ is asymptotically standard normal, where σ^2=[4(n-2)(5n^2-2n-9)]/[5n(n+1)(n-1)^2]. By using the alternative " ValueA list with class "htest" containing the components:
Author(s)Frederico Caeiro <fac@fct.unl.pt> ReferencesBartels, R. (1982). The Rank Version of von Neumann's Ratio Test for Randomness, Journal of the American Statistical Association, 77(377), 40-46. Gibbons, J.D. and Chakraborti, S. (2003). Nonparametric Statistical Inference, 4th ed. (pp. 97-98). URL: http://books.google.pt/books?id=dPhtioXwI9cC&lpg=PA97&ots=ZGaQCmuEUq See Also
Examples
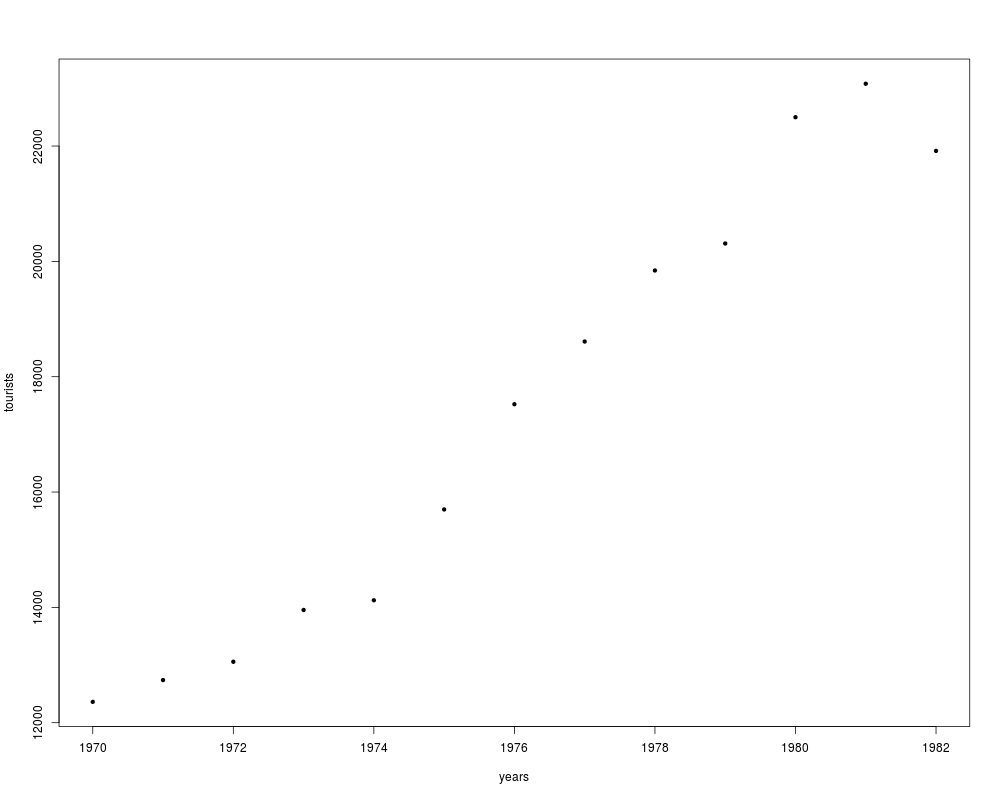
## Example 5.1 in Gibbons and Chakraborti (2003), p.98.
## Annual data on total number of tourists to the United States for 1970-1982.

years <- 1970:1982
tourists <- c(12362, 12739, 13057, 13955, 14123,  15698, 17523, 18610, 19842,
      20310, 22500, 23080, 21916)
plot(years, tourists, pch=20)

BartelsRankTest(tourists, alternative="trend", method="beta")

#  Bartels Ratio Test
#
# data:  tourists
# statistic = -3.6453, n = 13, p-value = 1.21e-08
# alternative hypothesis: trend


## Example in Bartels (1982).
## Changes in stock levels for 1968-1969 to 1977-1978 (in $A million), deflated by the
## Australian gross domestic product (GDP) price index (base 1966-1967).
x <- c(528, 348, 264, -20, - 167, 575, 410, -4, 430, - 122)

BartelsRankTest(x, method="beta")
Results
R version 3.3.1 (2016-06-21) -- "Bug in Your Hair"
Copyright (C) 2016 The R Foundation for Statistical Computing
Platform: x86_64-pc-linux-gnu (64-bit)

R is free software and comes with ABSOLUTELY NO WARRANTY.
You are welcome to redistribute it under certain conditions.
Type 'license()' or 'licence()' for distribution details.

R is a collaborative project with many contributors.
Type 'contributors()' for more information and
'citation()' on how to cite R or R packages in publications.

Type 'demo()' for some demos, 'help()' for on-line help, or
'help.start()' for an HTML browser interface to help.
Type 'q()' to quit R.

> library(DescTools)
> png(filename="/home/ddbj/snapshot/RGM3/R_CC/result/DescTools/BartelsRankTest.Rd_%03d_medium.png", width=480, height=480)
> ### Name: BartelsRankTest
> ### Title: Bartels Rank Test
> ### Aliases: BartelsRankTest
> ### Keywords: htest
>
> ### ** Examples
>
> ## Example 5.1 in Gibbons and Chakraborti (2003), p.98.
> ## Annual data on total number of tourists to the United States for 1970-1982.
>
> years <- 1970:1982
> tourists <- c(12362, 12739, 13057, 13955, 14123,  15698, 17523, 18610, 19842,
+       20310, 22500, 23080, 21916)
> plot(years, tourists, pch=20)
>
> BartelsRankTest(tourists, alternative="trend", method="beta")

	Bartels Ratio Test

data:  tourists
statistic = -3.6453, n = 13, p-value = 1.21e-08
alternative hypothesis: trend

>
> #  Bartels Ratio Test
> #
> # data:  tourists
> # statistic = -3.6453, n = 13, p-value = 1.21e-08
> # alternative hypothesis: trend
>
>
> ## Example in Bartels (1982).
> ## Changes in stock levels for 1968-1969 to 1977-1978 (in $A million), deflated by the
> ## Australian gross domestic product (GDP) price index (base 1966-1967).
> x <- c(528, 348, 264, -20, - 167, 575, 410, -4, 430, - 122)
>
> BartelsRankTest(x, method="beta")

	Bartels Ratio Test

data:  x
statistic = 0.083357, n = 10, p-value = 0.9379
alternative hypothesis: nonrandomness

>
>
>
>
>
> dev.off()
null device
          1
>
|