Supported by Dr. Osamu Ogasawara and  . . |
|
Last data update: 2014.03.03 |
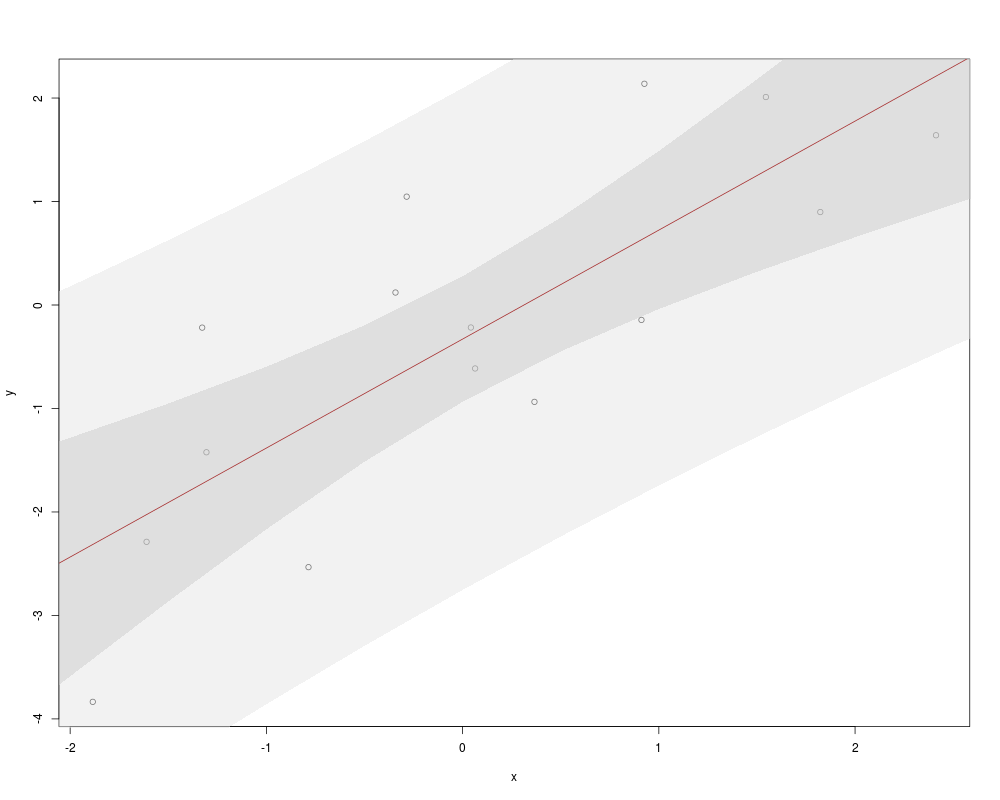
Draw Confidence BandDescriptionDraw a (confidence) band. Just a wrapper for polygon. Usage
DrawBand(x, y, col = SetAlpha("grey", 0.5), border = NA)
Arguments
Author(s)Andri Signorell <andri@signorell.net> See Also
Examples
set.seed(18)
x <- rnorm(15)
y <- x + rnorm(15)

new <- seq(-3, 3, 0.5)
pred.w.plim <- predict(lm(y ~ x), newdata=data.frame(x=new), interval="prediction")
pred.w.clim <- predict(lm(y ~ x), newdata=data.frame(x=new), interval="confidence")

plot(y ~ x)
DrawBand(y = c(pred.w.plim[,2], rev(pred.w.plim[,3])),
  x=c(new, rev(new)), col= SetAlpha("grey90", 0.5))

# passing y as matrix interface allows more intuitive arguments
DrawBand(y = pred.w.clim[, 2:3],
         x = new, col= SetAlpha("grey80", 0.5))

abline(lm(y~x), col="brown")
Results
R version 3.3.1 (2016-06-21) -- "Bug in Your Hair"
Copyright (C) 2016 The R Foundation for Statistical Computing
Platform: x86_64-pc-linux-gnu (64-bit)

R is free software and comes with ABSOLUTELY NO WARRANTY.
You are welcome to redistribute it under certain conditions.
Type 'license()' or 'licence()' for distribution details.

R is a collaborative project with many contributors.
Type 'contributors()' for more information and
'citation()' on how to cite R or R packages in publications.

Type 'demo()' for some demos, 'help()' for on-line help, or
'help.start()' for an HTML browser interface to help.
Type 'q()' to quit R.

> library(DescTools)
> png(filename="/home/ddbj/snapshot/RGM3/R_CC/result/DescTools/DrawBand.Rd_%03d_medium.png", width=480, height=480)
> ### Name: DrawBand
> ### Title: Draw Confidence Band
> ### Aliases: DrawBand
> ### Keywords: aplot
>
> ### ** Examples
>
> set.seed(18)
> x <- rnorm(15)
> y <- x + rnorm(15)
>
> new <- seq(-3, 3, 0.5)
> pred.w.plim <- predict(lm(y ~ x), newdata=data.frame(x=new), interval="prediction")
> pred.w.clim <- predict(lm(y ~ x), newdata=data.frame(x=new), interval="confidence")
>
> plot(y ~ x)
> DrawBand(y = c(pred.w.plim[,2], rev(pred.w.plim[,3])),
+   x=c(new, rev(new)), col= SetAlpha("grey90", 0.5))
>
> # passing y as matrix interface allows more intuitive arguments
> DrawBand(y = pred.w.clim[, 2:3],
+          x = new, col= SetAlpha("grey80", 0.5))
>
> abline(lm(y~x), col="brown")
>
>
>
>
>
> dev.off()
null device
          1
>
|
Created & Maintained by Osamu Ogasawara (osamu.ogasawara@gmail.com) and 