Supported by Dr. Osamu Ogasawara and  . . |
|
Last data update: 2014.03.03 |
Draw a Bezier CurveDescriptionDraw a Bezier curve. Usage
DrawBezier(x = 0, y = x, nv = 100, col = par("col"), lty = par("lty"),
           lwd = par("lwd"), plot = TRUE)
Arguments
DetailsBezier curves appear in such areas as mechanical computer aided design (CAD). They are named after P. Bezier, who used a closely related representation in Renault's UNISURF CAD system in the early 1960s (similar, unpublished, work was done by P. de Casteljau at Citroen in the late 1950s and early 1960s). The 1970s and 1980s saw a flowering of interest in Bezier curves, with many CAD systems using them, and many important developments in their theory. The usefulness of Bezier curves resides in their many geometric and analytical properties. There are elegant and efficient algorithms for evaluation, differentiation, subdivision of the curves, and conversion to other useful representations. (See: Farin, 1993) Value
Author(s)Frank E Harrell Jr <f.harrell@vanderbilt.edu> ReferencesG. Farin (1993) Curves and surfaces for computer aided geometric design. A practical guide, Acad. Press See Also
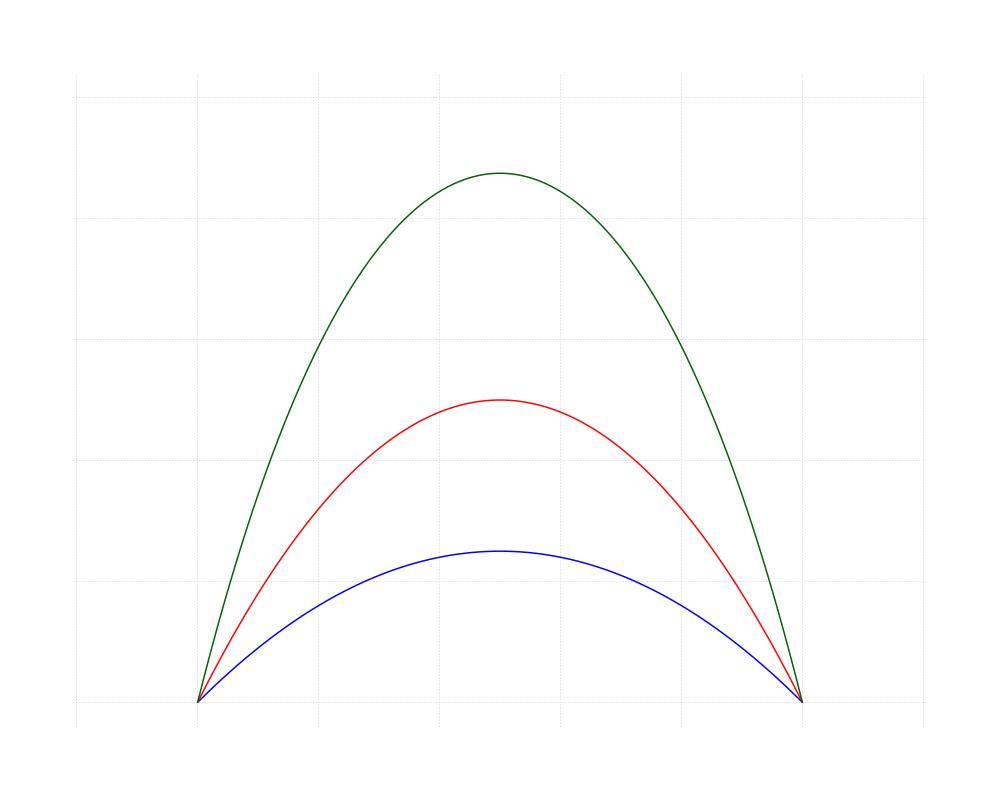
ExamplesCanvas(xlim=c(0,1)) grid() DrawBezier( x=c(0,0.5,1), y=c(0,0.5,0), col="blue", lwd=2) DrawBezier( x=c(0,0.5,1), y=c(0,1,0), col="red", lwd=2) DrawBezier( x=c(0,0.25,0.5,0.75,1), y=c(0,1,1,1,0), col="darkgreen", lwd=2) Results
R version 3.3.1 (2016-06-21) -- "Bug in Your Hair"
Copyright (C) 2016 The R Foundation for Statistical Computing
Platform: x86_64-pc-linux-gnu (64-bit)

R is free software and comes with ABSOLUTELY NO WARRANTY.
You are welcome to redistribute it under certain conditions.
Type 'license()' or 'licence()' for distribution details.

R is a collaborative project with many contributors.
Type 'contributors()' for more information and
'citation()' on how to cite R or R packages in publications.

Type 'demo()' for some demos, 'help()' for on-line help, or
'help.start()' for an HTML browser interface to help.
Type 'q()' to quit R.

> library(DescTools)
> png(filename="/home/ddbj/snapshot/RGM3/R_CC/result/DescTools/DrawBezier.Rd_%03d_medium.png", width=480, height=480)
> ### Name: DrawBezier
> ### Title: Draw a Bezier Curve
> ### Aliases: DrawBezier
> ### Keywords: aplot
>
> ### ** Examples
>
> Canvas(xlim=c(0,1))
> grid()
> DrawBezier( x=c(0,0.5,1), y=c(0,0.5,0), col="blue", lwd=2)
> DrawBezier( x=c(0,0.5,1), y=c(0,1,0), col="red", lwd=2)
> DrawBezier( x=c(0,0.25,0.5,0.75,1), y=c(0,1,1,1,0), col="darkgreen", lwd=2)
>
>
>
>
>
> dev.off()
null device
          1
>
|