Supported by Dr. Osamu Ogasawara and  . . |
|
Last data update: 2014.03.03 |
Draw a CircleDescriptionDraw one or several circle on an existing plot. Usage
DrawCircle(x = 0, y = x, radius = 1, rot = 0, nv = 100,
           border = par("fg"), col = par("bg"), lty = par("lty"),
           lwd = par("lwd"), plot = TRUE)
Arguments
DetailsAll geometric arguments will be recycled. ValueThe function invisibly returns a list of the calculated coordinates for all shapes. Author(s)Andri Signorell <andri@signorell.net> See Also
Examples
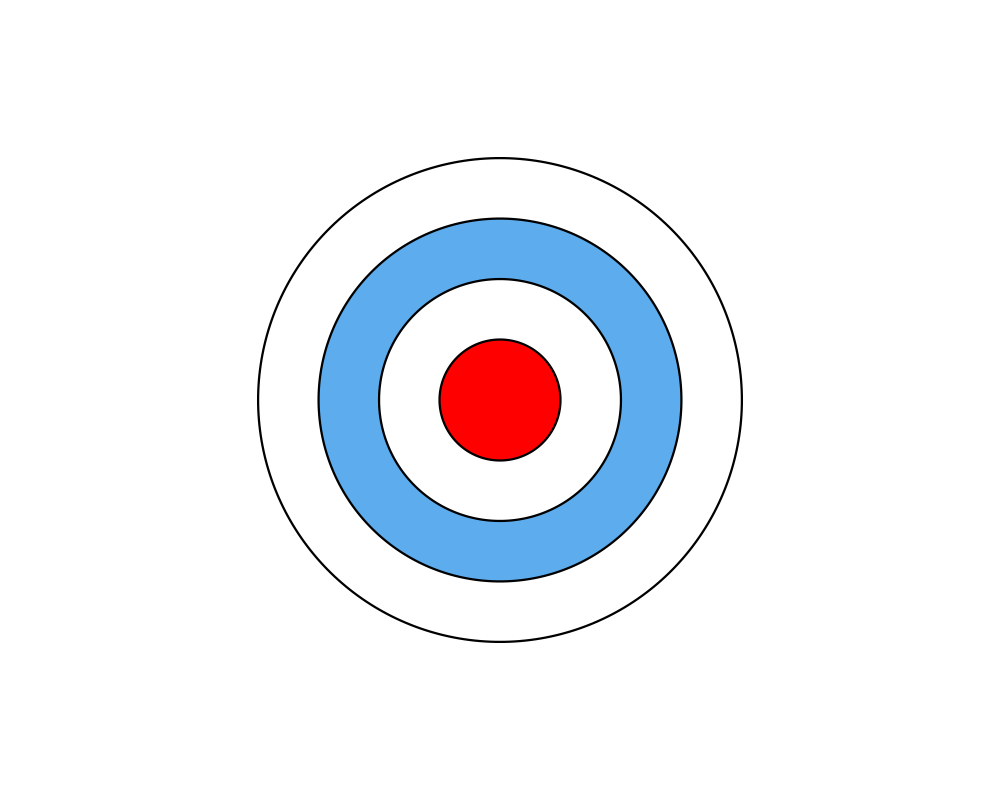
Canvas(xlim=c(-5,5))
DrawCircle( radius=4:1, col=c("white","steelblue2","white","red"), lwd=3, nv=300)
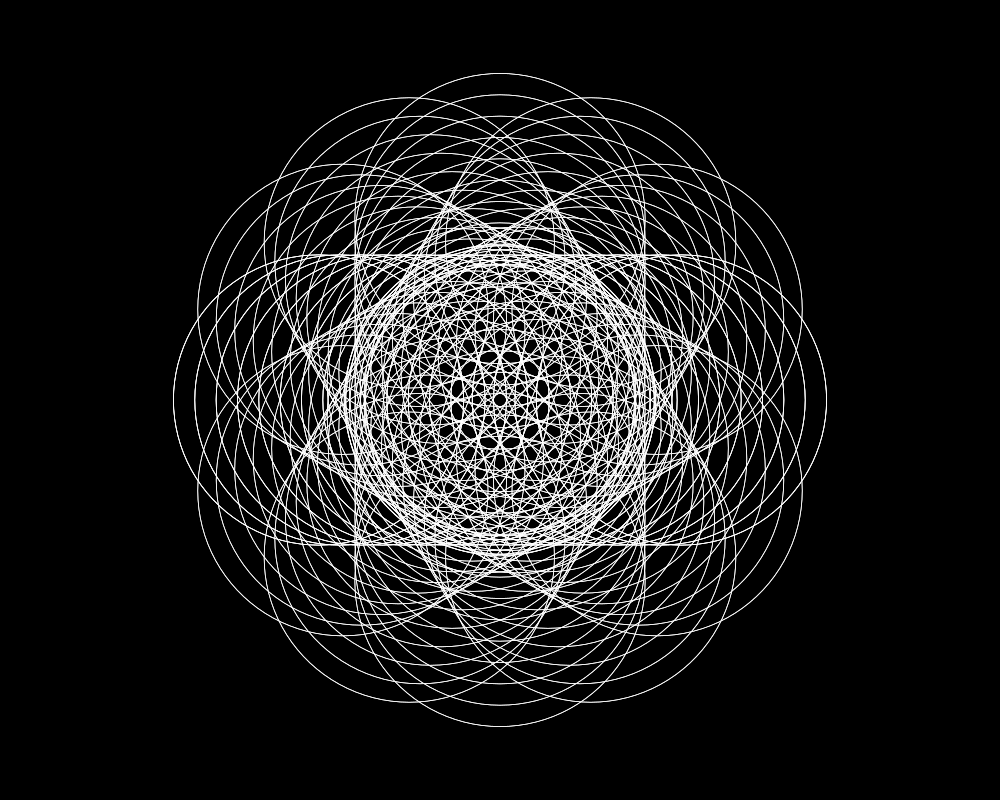
x <- seq(-3,3, length.out=18)
par(bg="black")
plot( x=c(-5,5), y=c(-5,5), asp=1, type="n", xaxt="n", yaxt="n", xlab="", ylab="")
sapply( (0:12) * pi/6, function(theta) {
xy <- Rotate( x, y=0, theta=theta )
DrawCircle( x=xy$x, y=xy$y, radius=2.4, border="white", col="transparent" )
} )
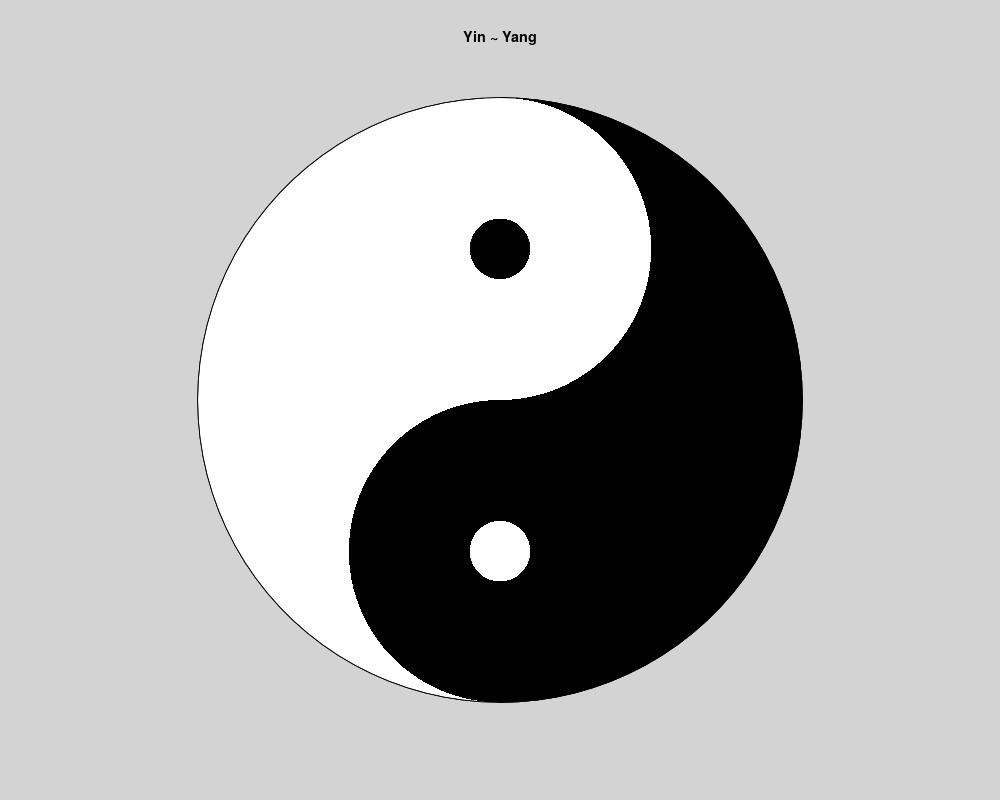
Canvas(bg="lightgrey", main="Yin ~ Yang")
DrawCircle(col="white")
clip(0, 2, 2, -2)
DrawCircle(col="black")
clip(-2, 2, 2, -2)
DrawCircle(y = c(-0.5,0.5), radius = 0.5, col=c("black","white"), border=NA)
DrawCircle(y = c(-0.5,0.5), radius = 0.1, col=c("white","black"), border=NA)
DrawCircle(col=NA)
Results
R version 3.3.1 (2016-06-21) -- "Bug in Your Hair"
Copyright (C) 2016 The R Foundation for Statistical Computing
Platform: x86_64-pc-linux-gnu (64-bit)

R is free software and comes with ABSOLUTELY NO WARRANTY.
You are welcome to redistribute it under certain conditions.
Type 'license()' or 'licence()' for distribution details.

R is a collaborative project with many contributors.
Type 'contributors()' for more information and
'citation()' on how to cite R or R packages in publications.

Type 'demo()' for some demos, 'help()' for on-line help, or
'help.start()' for an HTML browser interface to help.
Type 'q()' to quit R.

> library(DescTools)
> png(filename="/home/ddbj/snapshot/RGM3/R_CC/result/DescTools/DrawCircle.Rd_%03d_medium.png", width=480, height=480)
> ### Name: DrawCircle
> ### Title: Draw a Circle
> ### Aliases: DrawCircle
> ### Keywords: aplot
>
> ### ** Examples
>
> Canvas(xlim=c(-5,5))
> DrawCircle( radius=4:1, col=c("white","steelblue2","white","red"), lwd=3, nv=300)
>
>
> x <- seq(-3,3, length.out=18)
>
> par(bg="black")
> plot( x=c(-5,5), y=c(-5,5), asp=1, type="n", xaxt="n", yaxt="n", xlab="", ylab="")
>
> sapply( (0:12) * pi/6, function(theta) {
+   xy <- Rotate( x, y=0, theta=theta )
+   DrawCircle( x=xy$x, y=xy$y, radius=2.4, border="white", col="transparent" )
+ } )
      [,1]   [,2]   [,3]   [,4]   [,5]   [,6]   [,7]   [,8]   [,9]   [,10]
 [1,] List,2 List,2 List,2 List,2 List,2 List,2 List,2 List,2 List,2 List,2
 [2,] List,2 List,2 List,2 List,2 List,2 List,2 List,2 List,2 List,2 List,2
 [3,] List,2 List,2 List,2 List,2 List,2 List,2 List,2 List,2 List,2 List,2
 [4,] List,2 List,2 List,2 List,2 List,2 List,2 List,2 List,2 List,2 List,2
 [5,] List,2 List,2 List,2 List,2 List,2 List,2 List,2 List,2 List,2 List,2
 [6,] List,2 List,2 List,2 List,2 List,2 List,2 List,2 List,2 List,2 List,2
 [7,] List,2 List,2 List,2 List,2 List,2 List,2 List,2 List,2 List,2 List,2
 [8,] List,2 List,2 List,2 List,2 List,2 List,2 List,2 List,2 List,2 List,2
 [9,] List,2 List,2 List,2 List,2 List,2 List,2 List,2 List,2 List,2 List,2
[10,] List,2 List,2 List,2 List,2 List,2 List,2 List,2 List,2 List,2 List,2
[11,] List,2 List,2 List,2 List,2 List,2 List,2 List,2 List,2 List,2 List,2
[12,] List,2 List,2 List,2 List,2 List,2 List,2 List,2 List,2 List,2 List,2
[13,] List,2 List,2 List,2 List,2 List,2 List,2 List,2 List,2 List,2 List,2
[14,] List,2 List,2 List,2 List,2 List,2 List,2 List,2 List,2 List,2 List,2
[15,] List,2 List,2 List,2 List,2 List,2 List,2 List,2 List,2 List,2 List,2
[16,] List,2 List,2 List,2 List,2 List,2 List,2 List,2 List,2 List,2 List,2
[17,] List,2 List,2 List,2 List,2 List,2 List,2 List,2 List,2 List,2 List,2
[18,] List,2 List,2 List,2 List,2 List,2 List,2 List,2 List,2 List,2 List,2
      [,11]  [,12]  [,13]
 [1,] List,2 List,2 List,2
 [2,] List,2 List,2 List,2
 [3,] List,2 List,2 List,2
 [4,] List,2 List,2 List,2
 [5,] List,2 List,2 List,2
 [6,] List,2 List,2 List,2
 [7,] List,2 List,2 List,2
 [8,] List,2 List,2 List,2
 [9,] List,2 List,2 List,2
[10,] List,2 List,2 List,2
[11,] List,2 List,2 List,2
[12,] List,2 List,2 List,2
[13,] List,2 List,2 List,2
[14,] List,2 List,2 List,2
[15,] List,2 List,2 List,2
[16,] List,2 List,2 List,2
[17,] List,2 List,2 List,2
[18,] List,2 List,2 List,2
>
>
> Canvas(bg="lightgrey", main="Yin ~ Yang")
> DrawCircle(col="white")
> clip(0, 2, 2, -2)
> DrawCircle(col="black")
> clip(-2, 2, 2, -2)
> DrawCircle(y = c(-0.5,0.5), radius = 0.5, col=c("black","white"), border=NA)
> DrawCircle(y = c(-0.5,0.5), radius = 0.1, col=c("white","black"), border=NA)
> DrawCircle(col=NA)
>
>
>
>
>
> dev.off()
null device
          1
>
|