Supported by Dr. Osamu Ogasawara and  . . |
|
Last data update: 2014.03.03 |
Matrix of Hoeffding's D StatisticsDescriptionComputes a matrix of Hoeffding's (1948) UsageHoeffD(x, y) ## S3 method for class 'HoeffD' print(x, ...) Arguments
DetailsUses midranks in case of ties, as described by Hollander and Wolfe.
P-values are approximated by linear interpolation on the table
in Hollander and Wolfe, which uses the asymptotically equivalent
Blum-Kiefer-Rosenblatt statistic. For Valuea list with elements Author(s)Frank Harrell <f.harrell@vanderbilt.edu>
ReferencesHoeffding W. (1948) A non-parametric test of independence. Ann Math Stat 19:546–57. Hollander M., Wolfe D.A. (1973) Nonparametric Statistical Methods, pp. 228–235, 423. New York: Wiley. Press W.H., Flannery B.P., Teukolsky S.A., Vetterling, W.T. (1988) Numerical Recipes in C Cambridge: Cambridge University Press. See Also
Examplesx <- c(-2, -1, 0, 1, 2) y <- c(4, 1, 0, 1, 4) z <- c(1, 2, 3, 4, NA) q <- c(1, 2, 3, 4, 5) HoeffD(cbind(x, y, z, q)) # Hoeffding's test can detect even one-to-many dependency set.seed(1) x <- seq(-10, 10, length=200) y <- x * sign(runif(200, -1, 1)) plot(x, y) HoeffD(x, y) Results
R version 3.3.1 (2016-06-21) -- "Bug in Your Hair"
Copyright (C) 2016 The R Foundation for Statistical Computing
Platform: x86_64-pc-linux-gnu (64-bit)
R is free software and comes with ABSOLUTELY NO WARRANTY.
You are welcome to redistribute it under certain conditions.
Type 'license()' or 'licence()' for distribution details.
R is a collaborative project with many contributors.
Type 'contributors()' for more information and
'citation()' on how to cite R or R packages in publications.
Type 'demo()' for some demos, 'help()' for on-line help, or
'help.start()' for an HTML browser interface to help.
Type 'q()' to quit R.
> library(DescTools)
> png(filename="/home/ddbj/snapshot/RGM3/R_CC/result/DescTools/HoeffD.Rd_%03d_medium.png", width=480, height=480)
> ### Name: HoeffD
> ### Title: Matrix of Hoeffding's D Statistics
> ### Aliases: HoeffD print.HoeffD
> ### Keywords: nonparametric htest
>
> ### ** Examples
>
> x <- c(-2, -1, 0, 1, 2)
> y <- c(4, 1, 0, 1, 4)
> z <- c(1, 2, 3, 4, NA)
> q <- c(1, 2, 3, 4, 5)
>
> HoeffD(cbind(x, y, z, q))
D
x y z q
x 1 0 1 1
y 0 1 0 0
z 1 0 1 1
q 1 0 1 1
avg|F(x,y)-G(x)H(y)|
x y z q
x 0.00 0.04 0.16 0.16
y 0.04 0.00 0.04 0.04
z 0.16 0.04 0.00 0.16
q 0.16 0.04 0.16 0.00
max|F(x,y)-G(x)H(y)|
x y z q
x 0.00 0.1 0.24 0.24
y 0.10 0.0 0.10 0.10
z 0.24 0.1 0.00 0.24
q 0.24 0.1 0.24 0.00
n= 5
P
x y z q
x 0.3633 0.0000 0.0000
y 0.3633 0.3633 0.3633
z 0.0000 0.3633 0.0000
q 0.0000 0.3633 0.0000
>
>
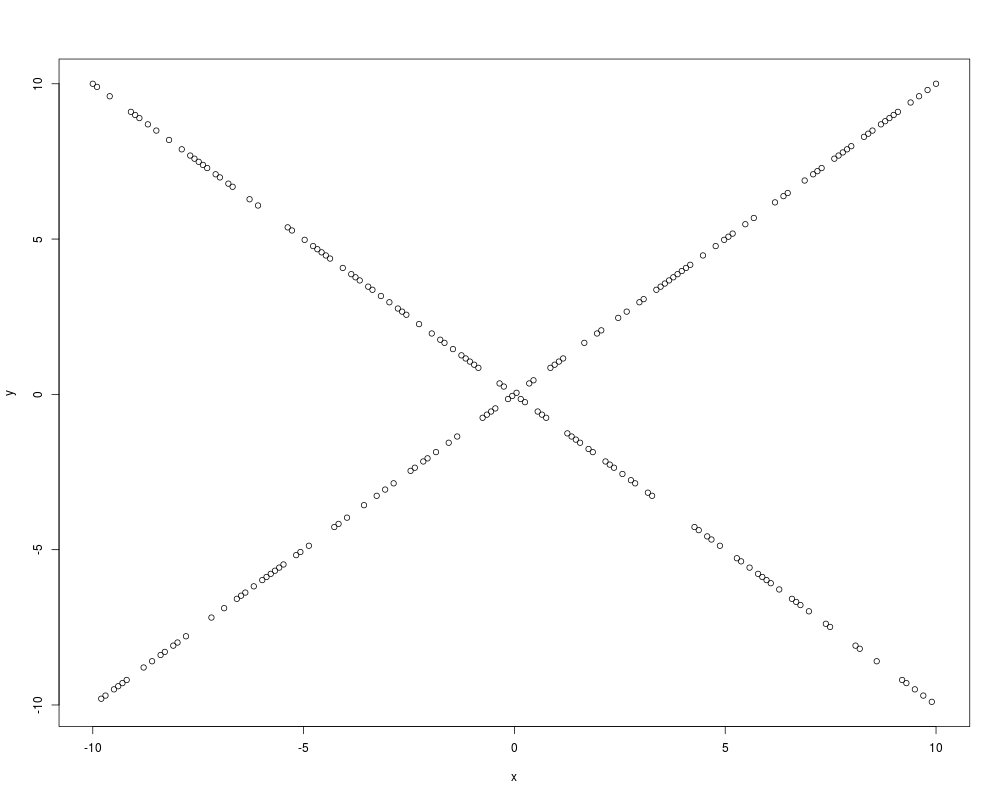
> # Hoeffding's test can detect even one-to-many dependency
> set.seed(1)
> x <- seq(-10, 10, length=200)
> y <- x * sign(runif(200, -1, 1))
> plot(x, y)
>
> HoeffD(x, y)
D
x y
x 1.00 0.06
y 0.06 1.00
avg|F(x,y)-G(x)H(y)|
x y
x 0.0000 0.0407
y 0.0407 0.0000
max|F(x,y)-G(x)H(y)|
x y
x 0.0000 0.0763
y 0.0763 0.0000
n= 200
P
x y
x 0
y 0
>
>
>
>
>
> dev.off()
null device
1
>
|