Supported by Dr. Osamu Ogasawara and  . . |
|
Last data update: 2014.03.03 |
Create an Area PlotDescriptionProduce a stacked area plot, or add polygons to an existing plot. Usage
## Default S3 method:
PlotArea(x, y = NULL, prop = FALSE, add = FALSE, xlab = NULL,
         ylab = NULL, col = NULL, frame.plot = FALSE, ...)

## S3 method for class 'formula'
PlotArea(formula, data, subset, na.action, ...)
Arguments
ValueMatrix of cumulative sums that was used for plotting. Author(s)Arni Magnusson <arnima@hafro.is> Referenceshttp://r.789695.n4.nabble.com/areaplot-td2255121.html See Also
Examples
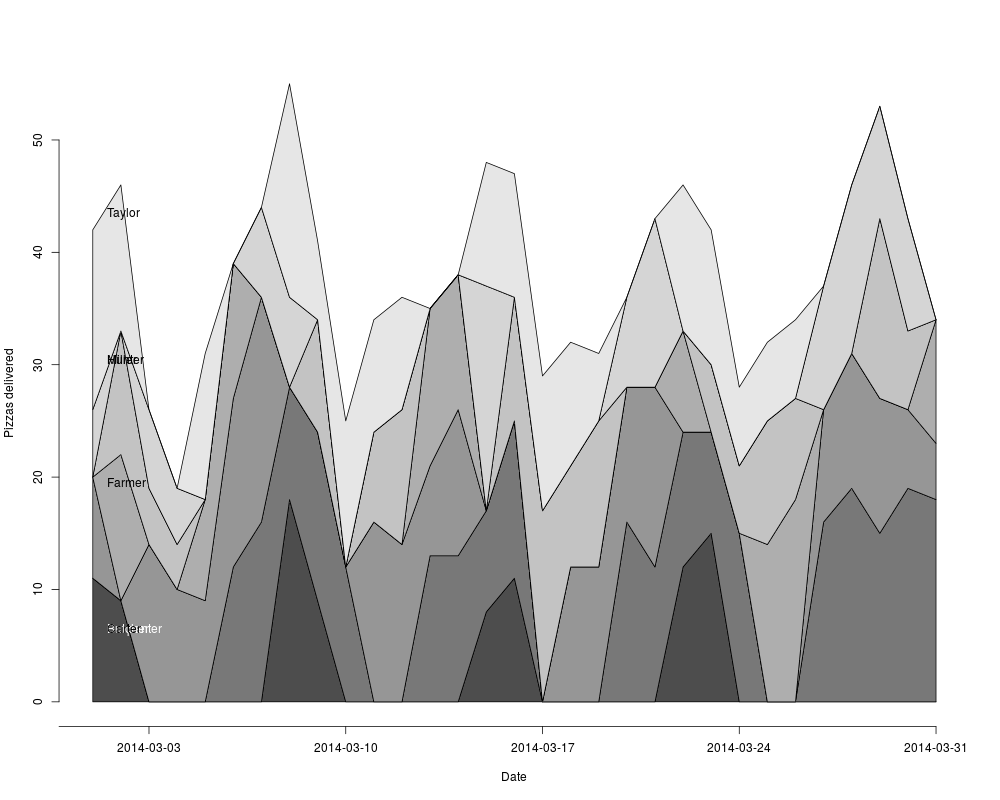
# PlotArea with stapled areas
tab <- table( d.pizza$date, d.pizza$driver )
PlotArea(x=as.Date(rownames(tab)), y=tab, xaxt="n", xlab="Date", ylab="Pizzas delivered" )
# add x-axis and some text labels
xrng <- pretty(range(as.Date(rownames(tab))))
axis(side=1, at=xrng, labels=xrng)
text( x=min(d.pizza$date + .5, na.rm=TRUE), y=cumsum(tab[2,])-2.5, label=levels(d.pizza$driver),
adj=c(0,0.5), col=TextContrastColor(gray.colors(7)))
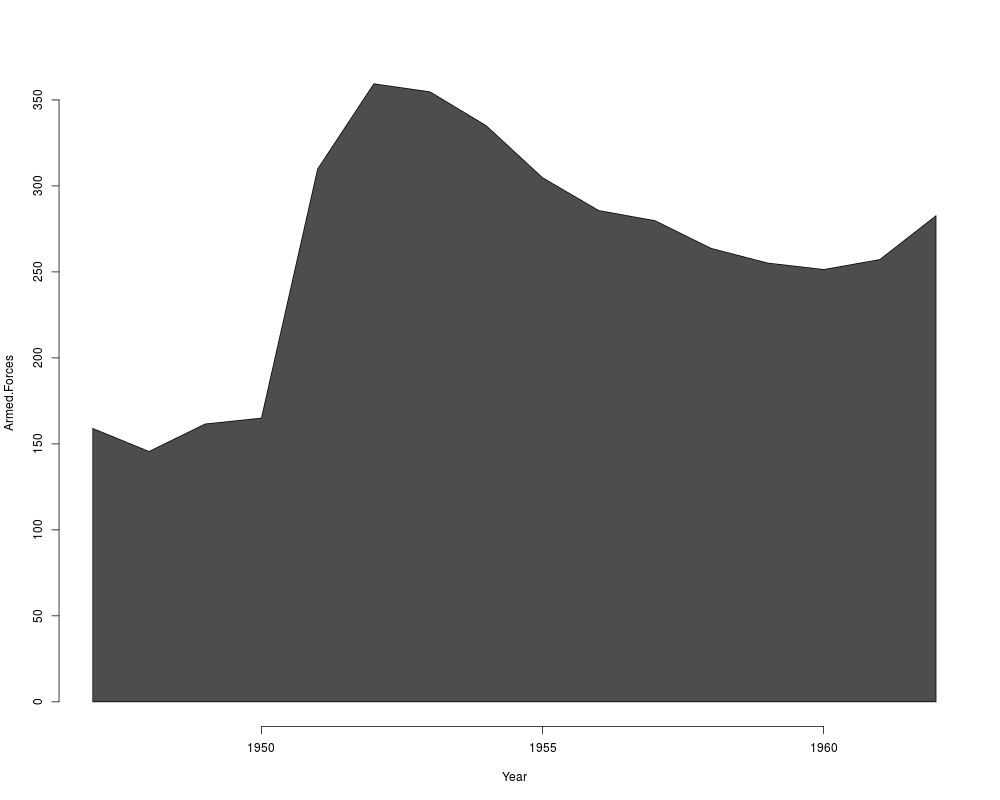
# formula
PlotArea(Armed.Forces~Year, data=longley)
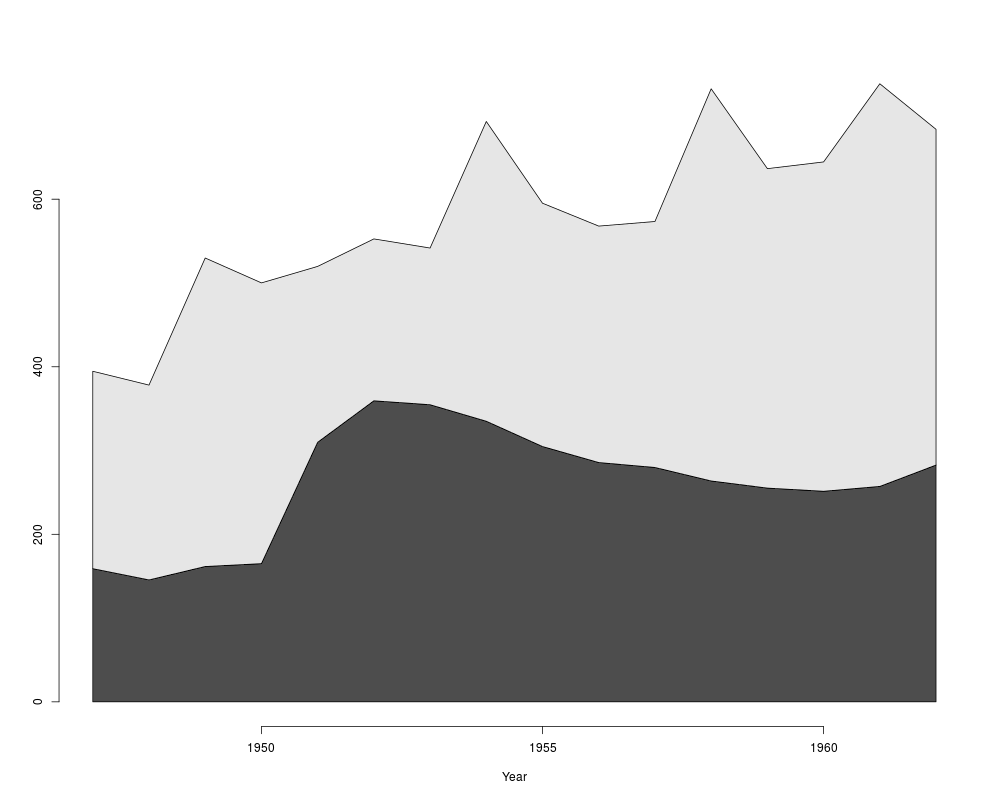
PlotArea(cbind(Armed.Forces,Unemployed)~Year, data=longley)
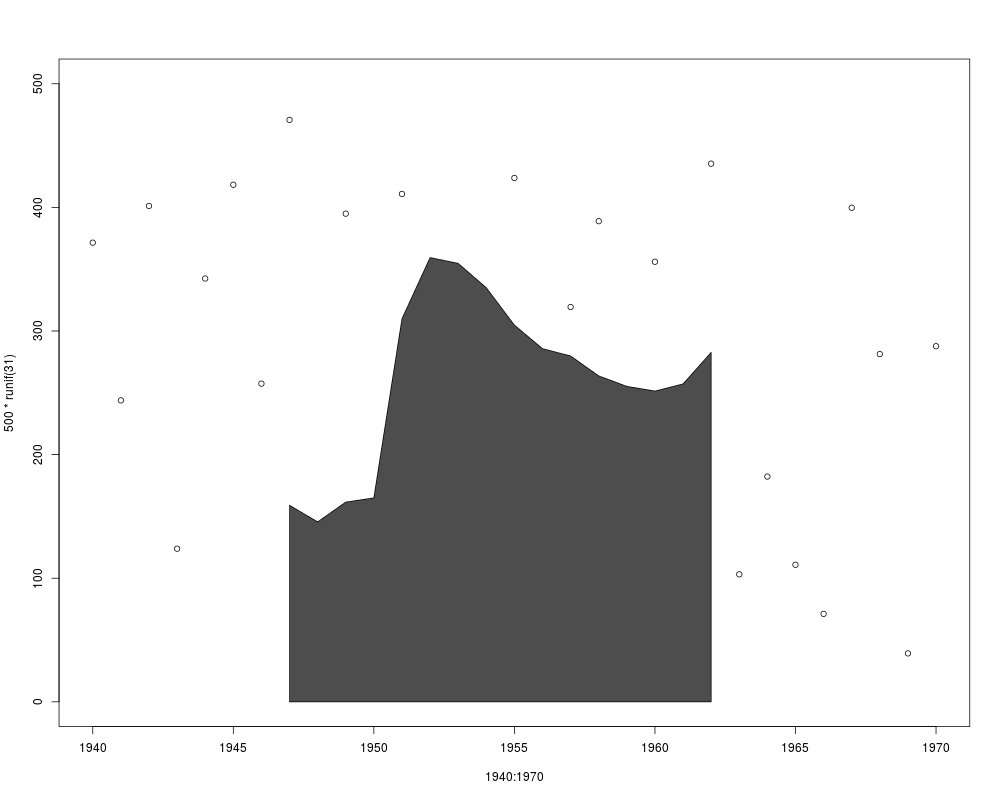
# add=TRUE
plot(1940:1970, 500*runif(31), ylim=c(0,500))
PlotArea(Armed.Forces~Year, data=longley, add=TRUE)
# matrix
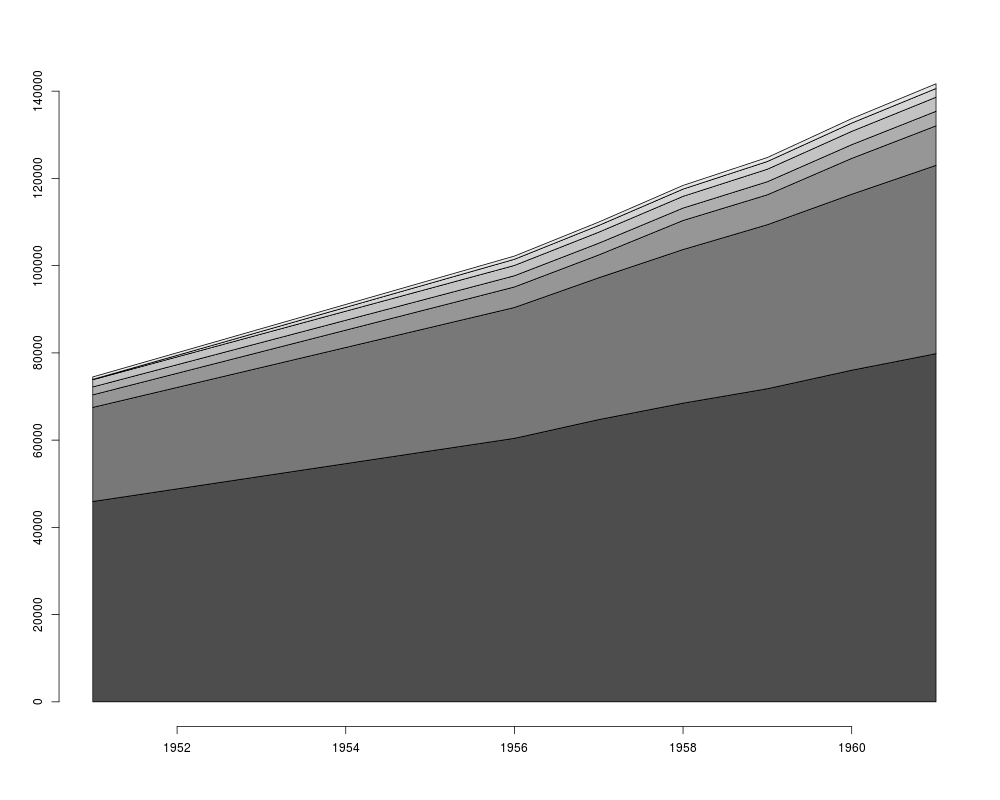
PlotArea(WorldPhones)
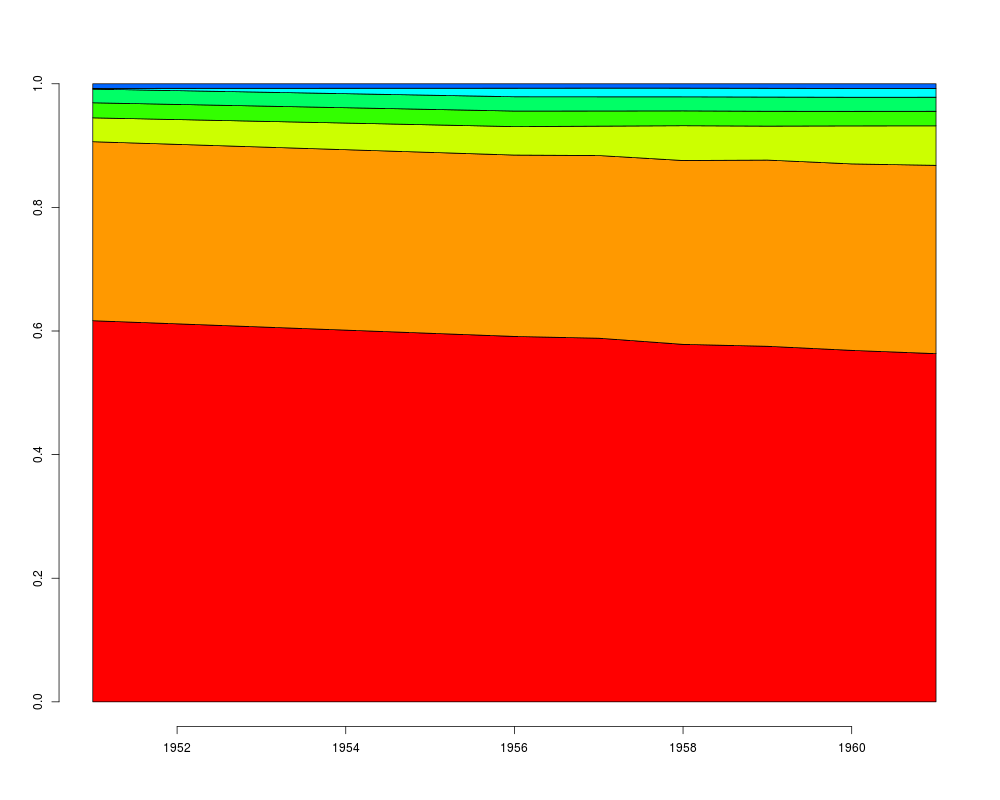
PlotArea(WorldPhones, prop=TRUE, col=rainbow(10))
# table
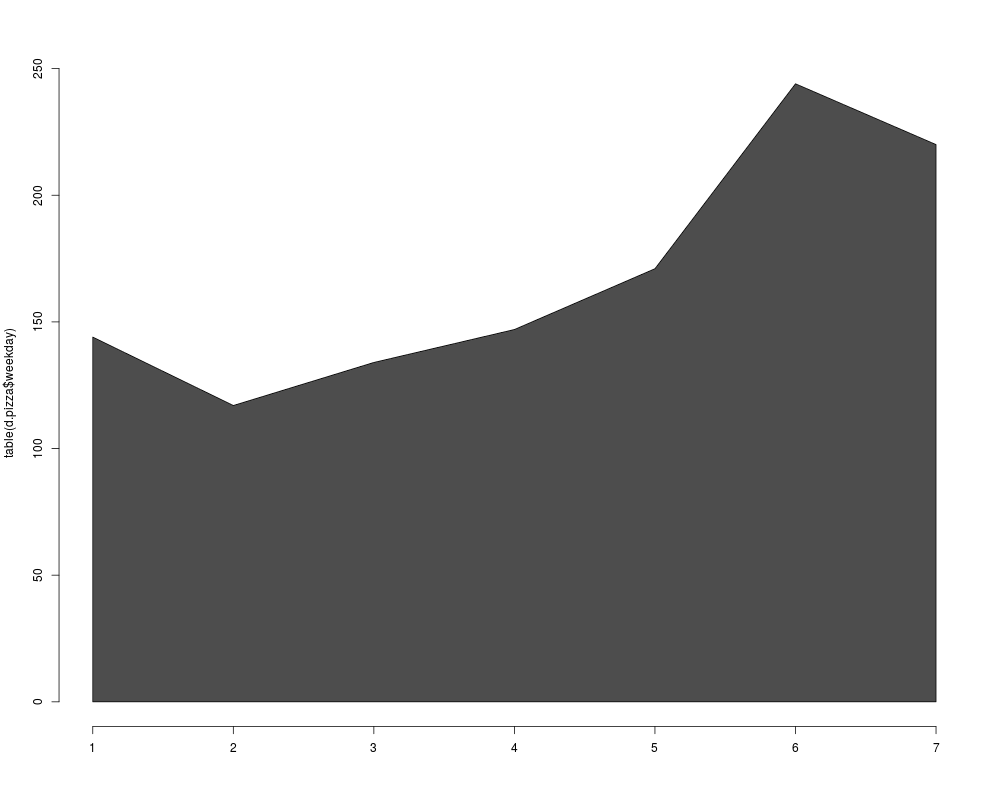
PlotArea(table(d.pizza$weekday))
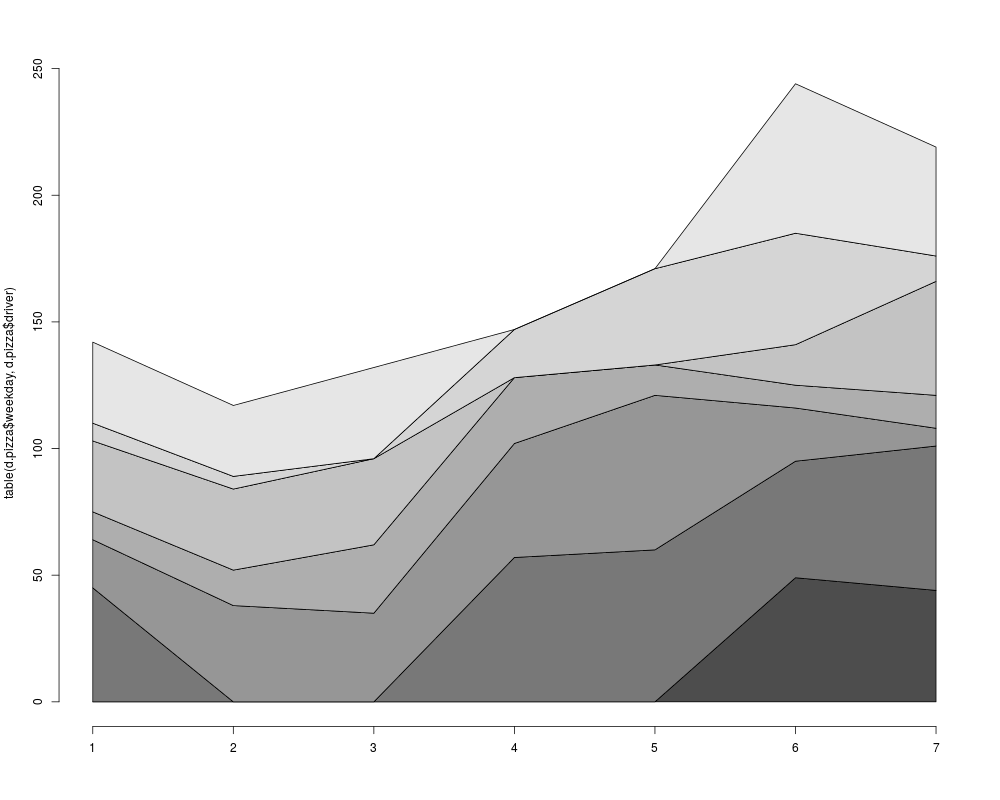
PlotArea(table(d.pizza$weekday, d.pizza$driver))
# ts/mts
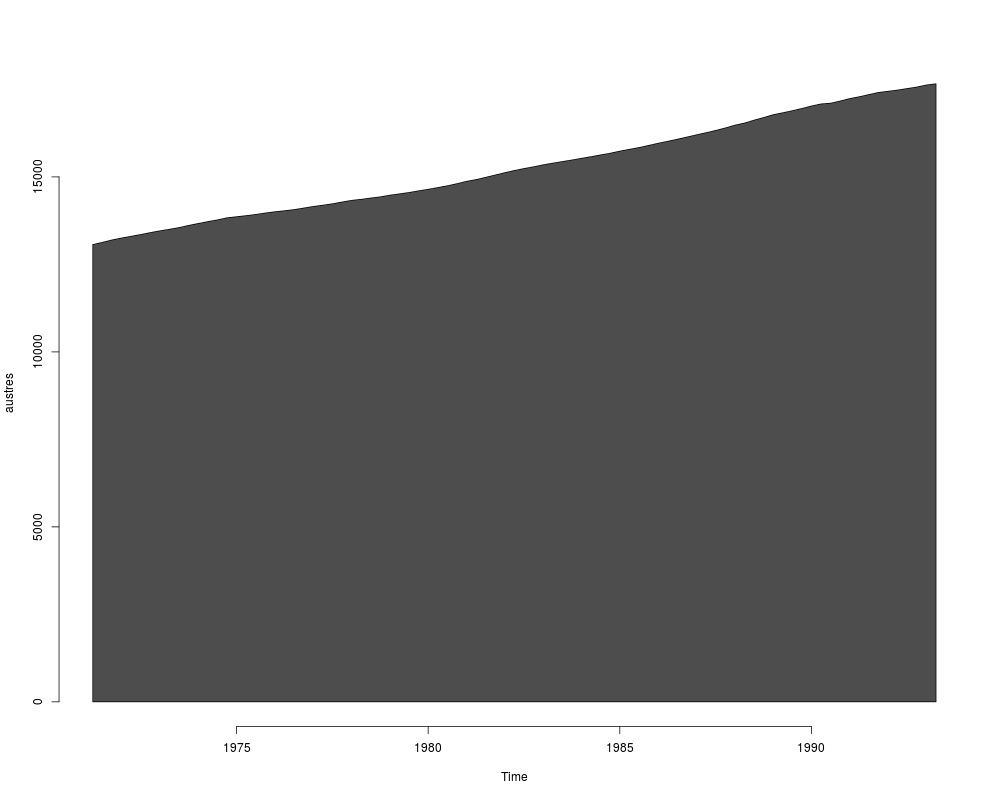
PlotArea(austres)
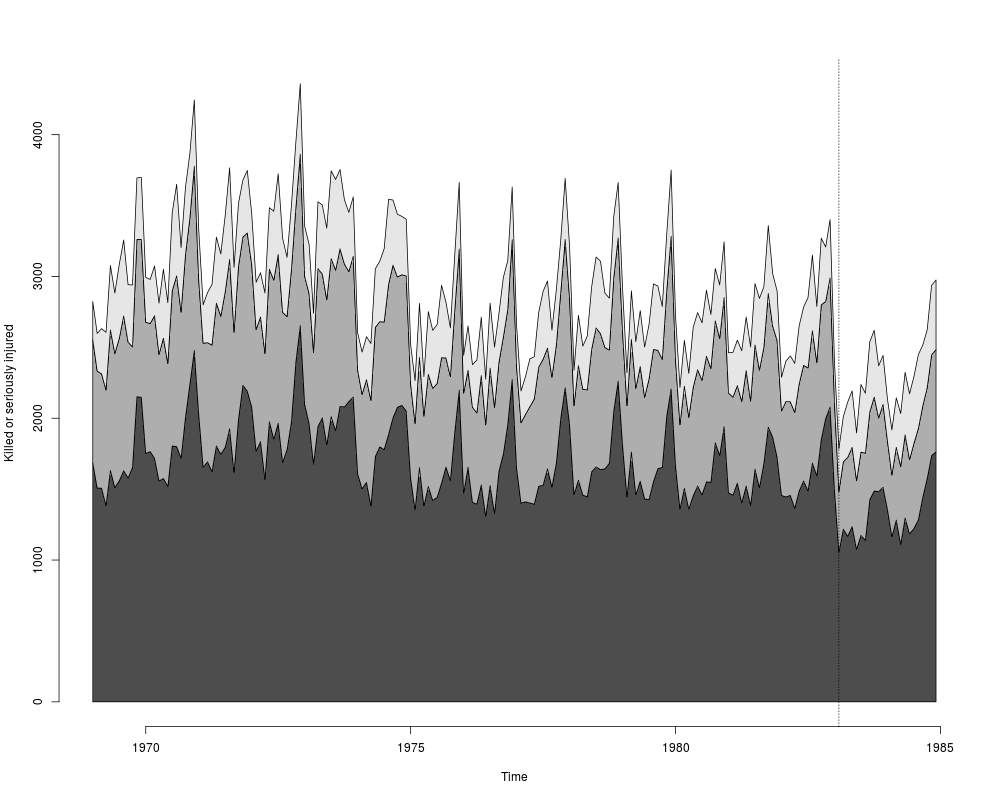
PlotArea(Seatbelts[,c("drivers","front","rear")],
ylab="Killed or seriously injured")
abline(v=1983+1/12, lty=3)
Results
R version 3.3.1 (2016-06-21) -- "Bug in Your Hair"
Copyright (C) 2016 The R Foundation for Statistical Computing
Platform: x86_64-pc-linux-gnu (64-bit)

R is free software and comes with ABSOLUTELY NO WARRANTY.
You are welcome to redistribute it under certain conditions.
Type 'license()' or 'licence()' for distribution details.

R is a collaborative project with many contributors.
Type 'contributors()' for more information and
'citation()' on how to cite R or R packages in publications.

Type 'demo()' for some demos, 'help()' for on-line help, or
'help.start()' for an HTML browser interface to help.
Type 'q()' to quit R.

> library(DescTools)
> png(filename="/home/ddbj/snapshot/RGM3/R_CC/result/DescTools/PlotArea.Rd_%03d_medium.png", width=480, height=480)
> ### Name: PlotArea
> ### Title: Create an Area Plot
> ### Aliases: PlotArea PlotArea.default PlotArea.formula
> ### Keywords: hplot
>
> ### ** Examples
>
> # PlotArea with stapled areas
> tab <- table( d.pizza$date, d.pizza$driver )
> PlotArea(x=as.Date(rownames(tab)), y=tab, xaxt="n", xlab="Date", ylab="Pizzas delivered" )
>
> # add x-axis and some text labels
> xrng <- pretty(range(as.Date(rownames(tab))))
> axis(side=1, at=xrng, labels=xrng)
> text( x=min(d.pizza$date + .5, na.rm=TRUE), y=cumsum(tab[2,])-2.5, label=levels(d.pizza$driver),
+   adj=c(0,0.5), col=TextContrastColor(gray.colors(7)))
>
>
> # formula
> PlotArea(Armed.Forces~Year, data=longley)
> PlotArea(cbind(Armed.Forces,Unemployed)~Year, data=longley)
>
> # add=TRUE
> plot(1940:1970, 500*runif(31), ylim=c(0,500))
> PlotArea(Armed.Forces~Year, data=longley, add=TRUE)
>
> # matrix
> PlotArea(WorldPhones)
> PlotArea(WorldPhones, prop=TRUE, col=rainbow(10))
>
> # table
> PlotArea(table(d.pizza$weekday))
> PlotArea(table(d.pizza$weekday, d.pizza$driver))
>
> # ts/mts
> PlotArea(austres)
> PlotArea(Seatbelts[,c("drivers","front","rear")],
+          ylab="Killed or seriously injured")
> abline(v=1983+1/12, lty=3)
>
>
>
>
>
> dev.off()
null device
          1
>
|