Supported by Dr. Osamu Ogasawara and  . . |
|
Last data update: 2014.03.03 |
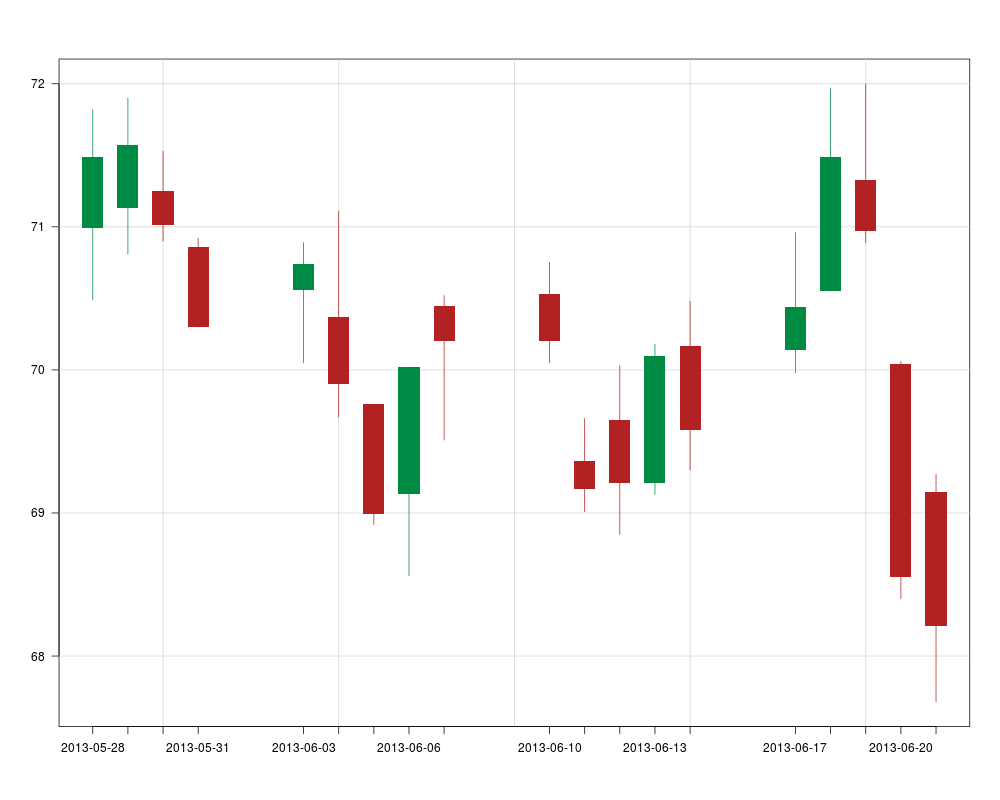
Plot Candlestick ChartDescriptionPlot a candlestick chart. This is used primarily to describe price movements of a security, derivative, or currency over time. Candlestick charts are a visual aid for decision making in stock, foreign exchange, commodity, and option trading. Usage
PlotCandlestick(x, y, xlim = NULL, ylim = NULL,
                col = c("springgreen4","firebrick"),
                border = NA, args.grid = NULL, ...)
Arguments
DetailsCandlesticks are usually composed of the body (black or white), and an upper and a lower shadow (wick): the area between the open and the close is called the real body, price excursions above and below the real body are called shadows. The wick illustrates the highest and lowest traded prices of a security during the time interval represented. The body illustrates the opening and closing trades. If the security closed higher than it opened, the body is white or unfilled, with the opening price at the bottom of the body and the closing price at the top. If the security closed lower than it opened, the body is black, with the opening price at the top and the closing price at the bottom. A candlestick need not have either a body or a wick. Author(s)Andri Signorell <andri@signorell.net> See Also
Examples
nov <- rbind(
 "2013-05-28"= c(70.99,71.82,70.49,71.49),
 "2013-05-29"= c(71.13,71.90,70.81,71.57),
 "2013-05-30"= c(71.25,71.53,70.90,71.01),
 "2013-05-31"= c(70.86,70.92,70.30,70.30),
 "2013-06-03"= c(70.56,70.89,70.05,70.74),
 "2013-06-04"= c(70.37,71.11,69.67,69.90),
 "2013-06-05"= c(69.76,69.76,68.92,68.99),
 "2013-06-06"= c(69.13,70.02,68.56,70.02),
 "2013-06-07"= c(70.45,70.52,69.51,70.20),
 "2013-06-10"= c(70.53,70.75,70.05,70.20),
 "2013-06-11"= c(69.36,69.66,69.01,69.17),
 "2013-06-12"= c(69.65,70.03,68.85,69.21),
 "2013-06-13"= c(69.21,70.18,69.13,70.10),
 "2013-06-14"= c(70.17,70.48,69.30,69.58),
 "2013-06-17"= c(70.14,70.96,69.98,70.44),
 "2013-06-18"= c(70.55,71.97,70.55,71.49),
 "2013-06-19"= c(71.33,72.00,70.89,70.97),
 "2013-06-20"= c(70.04,70.06,68.40,68.55),
 "2013-06-21"= c(69.15,69.27,67.68,68.21)
)
colnames(nov) <- c("open","high","low","close")

PlotCandlestick(x=as.Date(rownames(nov)), y=nov, border=NA, las=1, ylab="")
Results
R version 3.3.1 (2016-06-21) -- "Bug in Your Hair"
Copyright (C) 2016 The R Foundation for Statistical Computing
Platform: x86_64-pc-linux-gnu (64-bit)

R is free software and comes with ABSOLUTELY NO WARRANTY.
You are welcome to redistribute it under certain conditions.
Type 'license()' or 'licence()' for distribution details.

R is a collaborative project with many contributors.
Type 'contributors()' for more information and
'citation()' on how to cite R or R packages in publications.

Type 'demo()' for some demos, 'help()' for on-line help, or
'help.start()' for an HTML browser interface to help.
Type 'q()' to quit R.

> library(DescTools)
> png(filename="/home/ddbj/snapshot/RGM3/R_CC/result/DescTools/PlotCandlestick.Rd_%03d_medium.png", width=480, height=480)
> ### Name: PlotCandlestick
> ### Title: Plot Candlestick Chart
> ### Aliases: PlotCandlestick
> ### Keywords: hplot
>
> ### ** Examples
>
> nov <- rbind(
+  "2013-05-28"= c(70.99,71.82,70.49,71.49),
+  "2013-05-29"= c(71.13,71.90,70.81,71.57),
+  "2013-05-30"= c(71.25,71.53,70.90,71.01),
+  "2013-05-31"= c(70.86,70.92,70.30,70.30),
+  "2013-06-03"= c(70.56,70.89,70.05,70.74),
+  "2013-06-04"= c(70.37,71.11,69.67,69.90),
+  "2013-06-05"= c(69.76,69.76,68.92,68.99),
+  "2013-06-06"= c(69.13,70.02,68.56,70.02),
+  "2013-06-07"= c(70.45,70.52,69.51,70.20),
+  "2013-06-10"= c(70.53,70.75,70.05,70.20),
+  "2013-06-11"= c(69.36,69.66,69.01,69.17),
+  "2013-06-12"= c(69.65,70.03,68.85,69.21),
+  "2013-06-13"= c(69.21,70.18,69.13,70.10),
+  "2013-06-14"= c(70.17,70.48,69.30,69.58),
+  "2013-06-17"= c(70.14,70.96,69.98,70.44),
+  "2013-06-18"= c(70.55,71.97,70.55,71.49),
+  "2013-06-19"= c(71.33,72.00,70.89,70.97),
+  "2013-06-20"= c(70.04,70.06,68.40,68.55),
+  "2013-06-21"= c(69.15,69.27,67.68,68.21)
+ )
> colnames(nov) <- c("open","high","low","close")
>
> PlotCandlestick(x=as.Date(rownames(nov)), y=nov, border=NA, las=1, ylab="")
>
>
>
>
>
> dev.off()
null device
          1
>
|