Supported by Dr. Osamu Ogasawara and  . . |
|
Last data update: 2014.03.03 |
Cleveland's Dot PlotsDescriptionDraw a Cleveland dot plot. This is an extended version of Usage
PlotDot(x, labels = NULL, groups = NULL, gdata = NULL,
        cex = par("cex"), pch = 21, gpch = 21, bg = par("bg"),
        color = par("fg"), gcolor = par("fg"), lcolor = "gray",
        xlim = NULL, main = NULL, xlab = NULL, ylab = NULL,
        add = FALSE, args.errbars = NULL, ...)
Arguments
DetailsThis function is invoked for its side effect, which is to produce two variants of dotplots as described in Cleveland (1985). Dot plots are a reasonable substitute for bar plots. ValueReturn the y-values used for plotting. Author(s)R-Core with some extensions by Andri Signorell <andri@signorell.net> ReferencesBecker, R. A., Chambers, J. M. and Wilks, A. R. (1988) The New S Language. Wadsworth & Brooks/Cole. Cleveland, W. S. (1985) The Elements of Graphing Data. Monterey, CA: Wadsworth. Murrell, P. (2005) R Graphics. Chapman & Hall/CRC Press. Examples
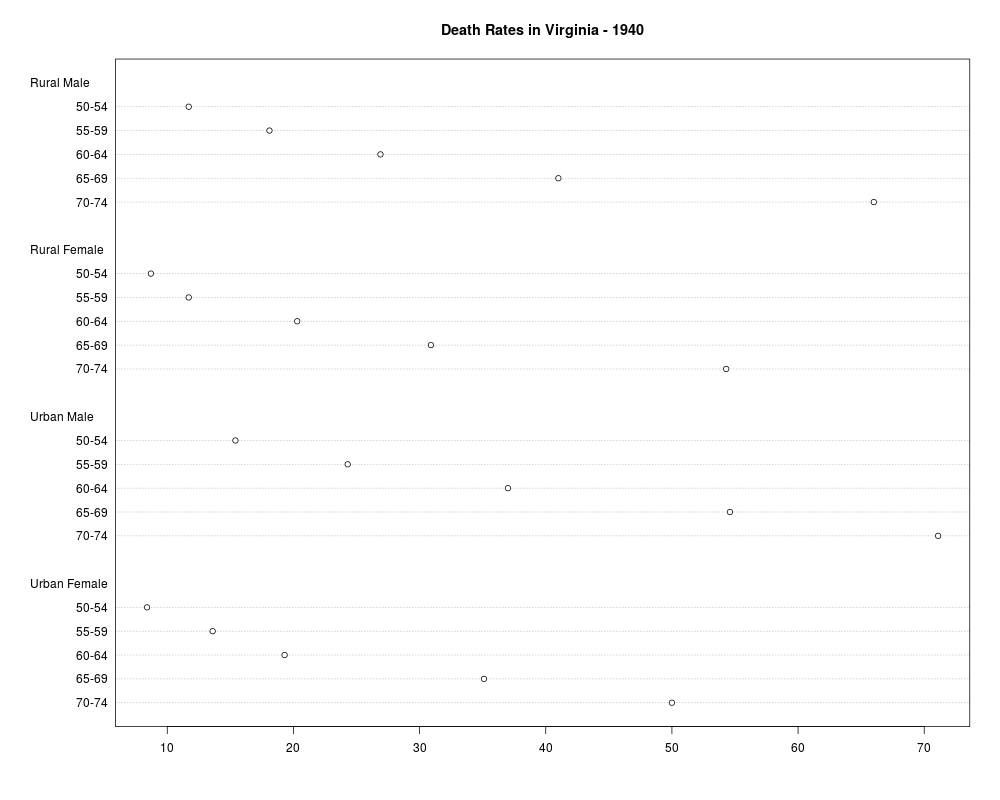
PlotDot(VADeaths, main = "Death Rates in Virginia - 1940")
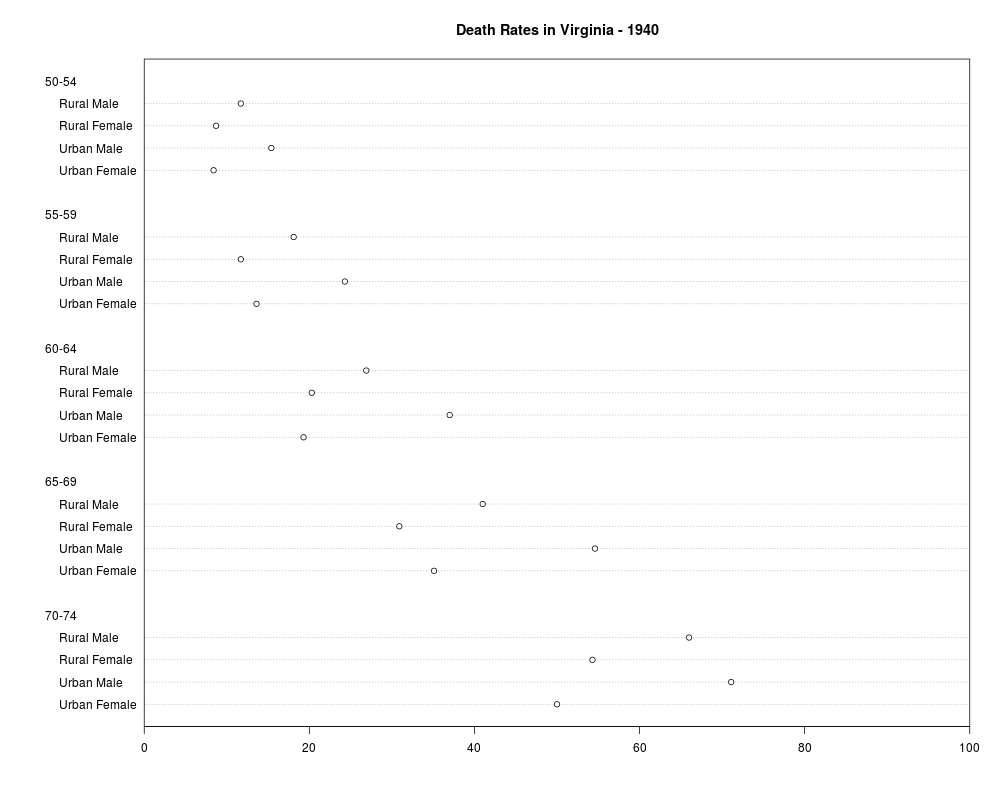
op <- par(xaxs = "i") # 0 -- 100%
PlotDot(t(VADeaths), xlim = c(0,100),
main = "Death Rates in Virginia - 1940")
par(op)
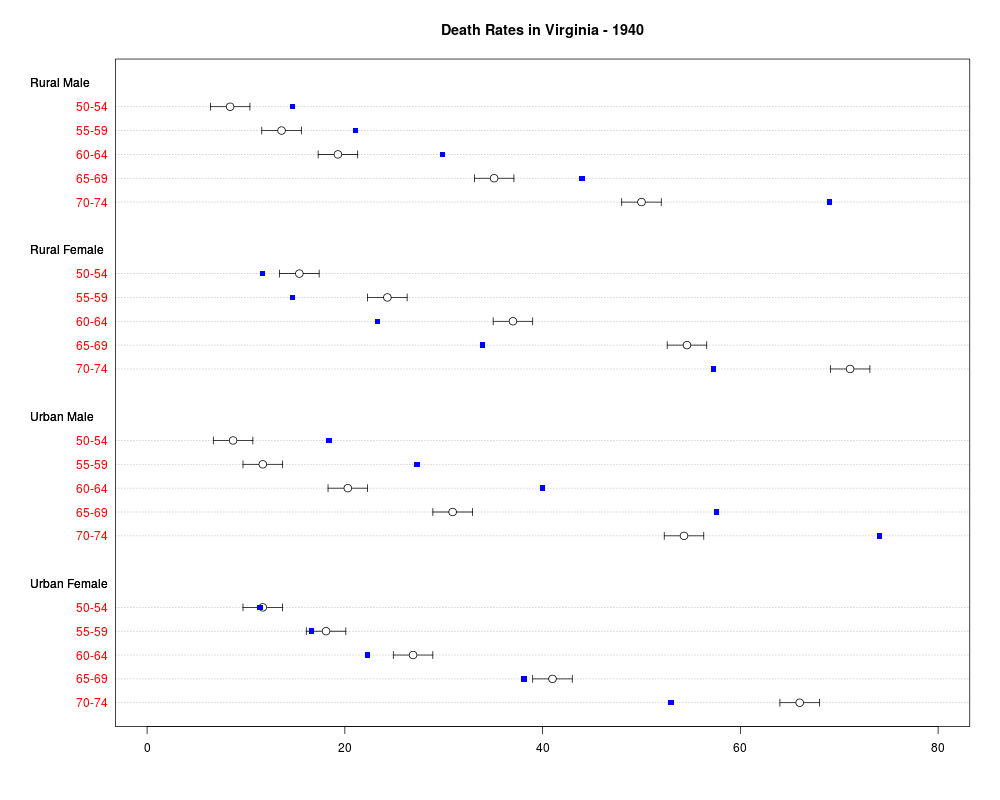
# add some error bars
PlotDot(VADeaths, main="Death Rates in Virginia - 1940", col="red", pch=NA,
args.errbars = list(from=VADeaths-2, to=VADeaths+2, mid=VADeaths,
pch=21, cex=1.4))
# add some other values
PlotDot(VADeaths+3, pch=15, col="blue", add=TRUE, labels=NA)
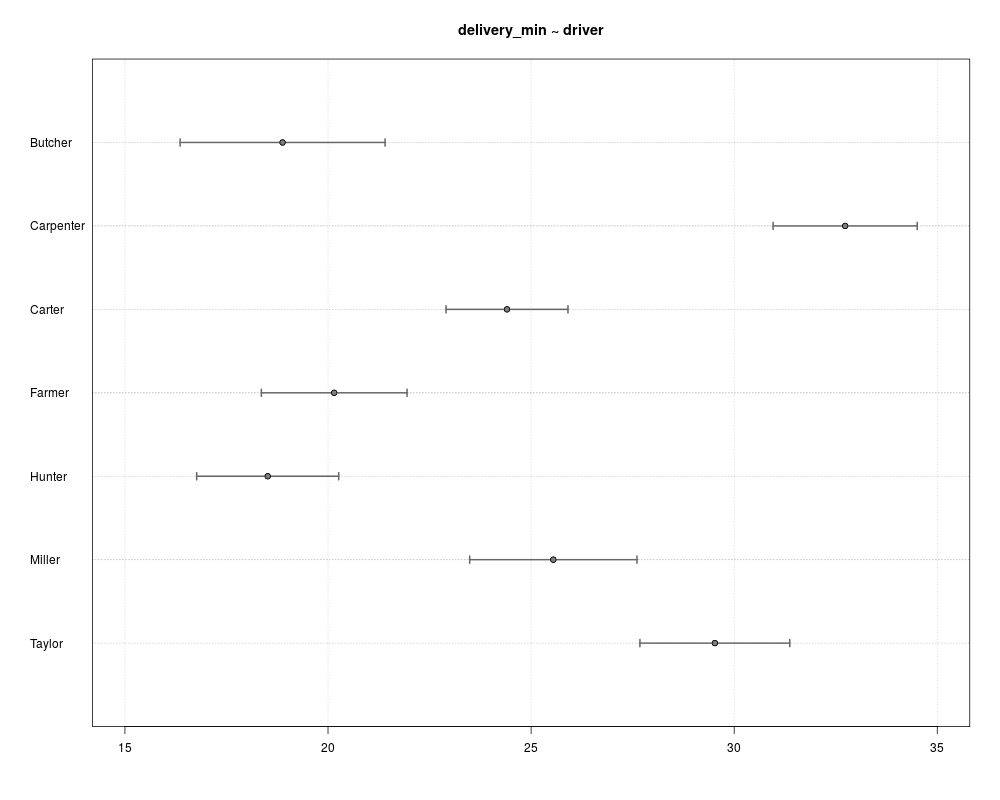
# same as PlotDotCI
xci <- do.call(rbind, tapply( d.pizza$delivery_min, d.pizza$driver,
MeanCI, conf.level=0.99, na.rm=TRUE))
PlotDot(xci[,1], main="delivery_min ~ driver",
args.errbars = list(from=xci[,2], to=xci[,3], mid=xci[,1],
lwd=2, pch=21, col="grey40", bg.pch="grey50", col.pch="black"),
xlim=c(15,35), panel.before=grid())
# with group data
x <- with(d.pizza, tapply(temperature, list(area, driver), mean, na.rm=TRUE))
PlotDot(x, gdata = tapply(d.pizza$temperature, d.pizza$driver, mean, na.rm=TRUE),
gpch = 15)
# special format
par(lend=1)
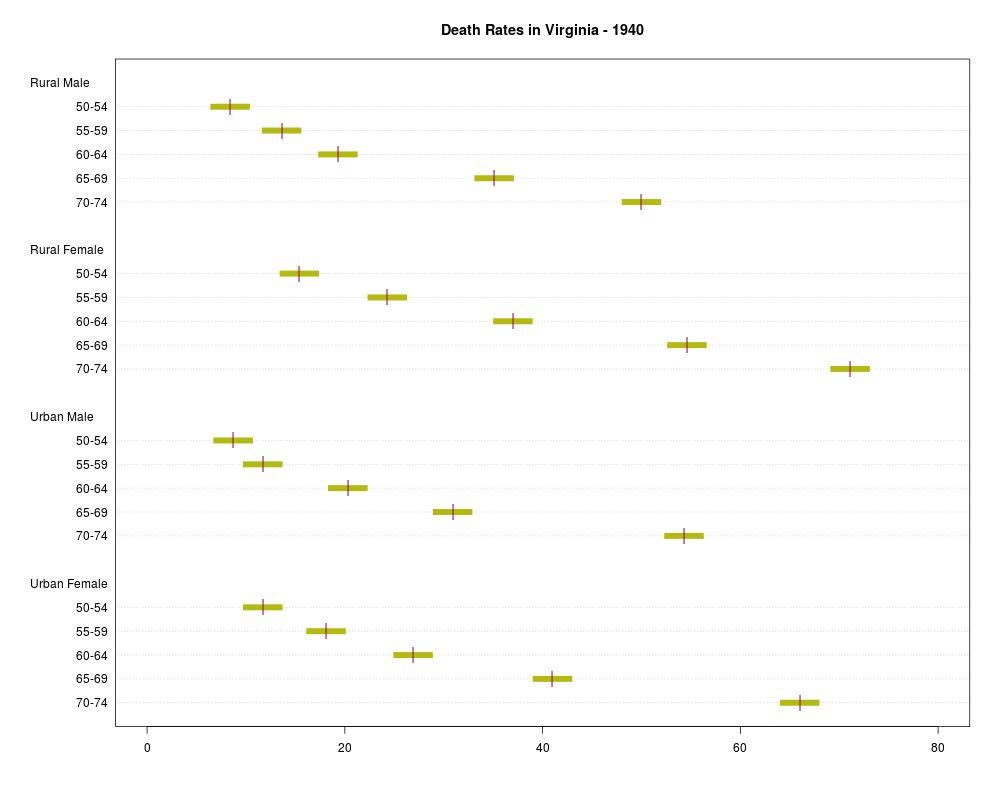
PlotDot(VADeaths, main="Death Rates in Virginia - 1940", pch=NA, lcolor = hecru,
args.errbars = list(from=VADeaths-2, to=VADeaths+2, mid=VADeaths,
pch="|", col.pch=hred, cex=1.3, lwd=8, code=0, col=hgreen))
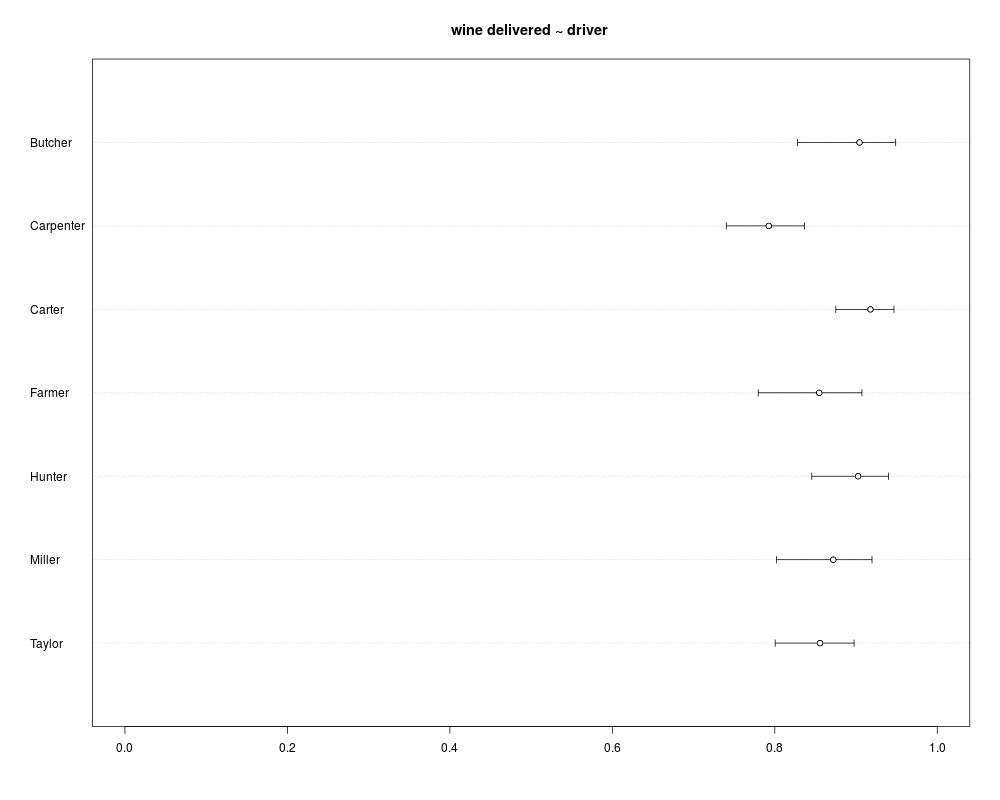
# Error bars for binomial confidence intervals
tab <- table(d.pizza$driver, d.pizza$wine_delivered)
xci <- SetRowNames(BinomCI(tab[,1], rowSums(tab)), rownames(tab))
PlotDot(xci[,1], main="wine delivered ~ driver ", xlim=c(0,1),
args.errbars=list(from=xci[,-1], mid=xci[,1], pch=21))
# Error bars for confidence intervals for means
xci <- do.call(rbind, tapply(d.pizza$delivery_min, d.pizza$driver,
MeanCI, conf.level=0.99, na.rm=TRUE))
PlotDot(xci[,1], main="delivery_min ~ driver",
args.errbars=list(from=xci[,-1]))
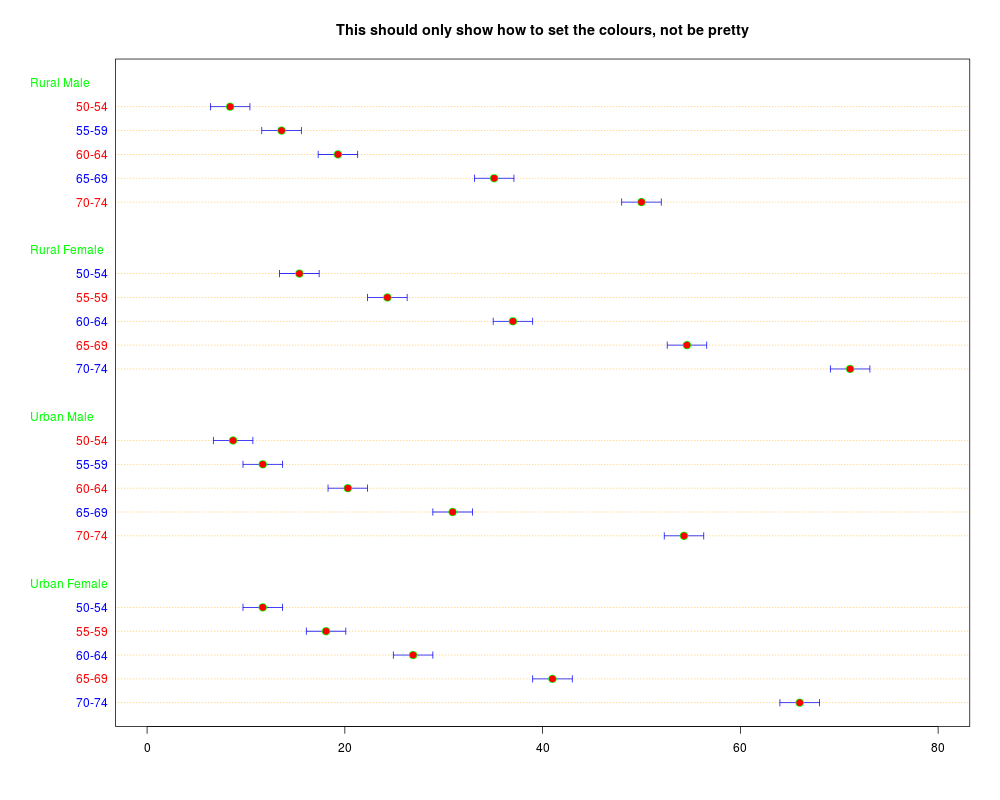
# Setting the colours
PlotDot(VADeaths, main="This should only show how to set the colours, not be pretty",
col=c("red", "blue"), pch=NA, gcolor = "green", lcolor = "orange",
args.errbars = list(from=VADeaths-2, to=VADeaths+2, mid=VADeaths,
pch=21, cex=1.4, col="blue", col.pch="green", bg.pch="red"))
Results
R version 3.3.1 (2016-06-21) -- "Bug in Your Hair"
Copyright (C) 2016 The R Foundation for Statistical Computing
Platform: x86_64-pc-linux-gnu (64-bit)

R is free software and comes with ABSOLUTELY NO WARRANTY.
You are welcome to redistribute it under certain conditions.
Type 'license()' or 'licence()' for distribution details.

R is a collaborative project with many contributors.
Type 'contributors()' for more information and
'citation()' on how to cite R or R packages in publications.

Type 'demo()' for some demos, 'help()' for on-line help, or
'help.start()' for an HTML browser interface to help.
Type 'q()' to quit R.

> library(DescTools)
> png(filename="/home/ddbj/snapshot/RGM3/R_CC/result/DescTools/PlotDot.Rd_%03d_medium.png", width=480, height=480)
> ### Name: PlotDot
> ### Title: Cleveland's Dot Plots
> ### Aliases: PlotDot
> ### Keywords: hplot
>
> ### ** Examples
>
> PlotDot(VADeaths, main = "Death Rates in Virginia - 1940")
> op <- par(xaxs = "i")  # 0 -- 100%
> PlotDot(t(VADeaths), xlim = c(0,100),
+          main = "Death Rates in Virginia - 1940")
> par(op)
>
> # add some error bars
> PlotDot(VADeaths, main="Death Rates in Virginia - 1940", col="red", pch=NA,
+         args.errbars = list(from=VADeaths-2, to=VADeaths+2, mid=VADeaths,
+         pch=21, cex=1.4))
>
> # add some other values
> PlotDot(VADeaths+3, pch=15, col="blue", add=TRUE, labels=NA)
>
> # same as PlotDotCI
> xci <- do.call(rbind, tapply( d.pizza$delivery_min, d.pizza$driver,
+                MeanCI, conf.level=0.99, na.rm=TRUE))
>
> PlotDot(xci[,1], main="delivery_min ~ driver",
+         args.errbars = list(from=xci[,2], to=xci[,3], mid=xci[,1],
+         lwd=2, pch=21, col="grey40", bg.pch="grey50", col.pch="black"),
+         xlim=c(15,35), panel.before=grid())
>
> # with group data
> x <- with(d.pizza, tapply(temperature, list(area, driver), mean, na.rm=TRUE))
>
> PlotDot(x, gdata = tapply(d.pizza$temperature, d.pizza$driver, mean, na.rm=TRUE),
+         gpch = 15)
>
> # special format
> par(lend=1)
>
> PlotDot(VADeaths, main="Death Rates in Virginia - 1940", pch=NA, lcolor = hecru,
+         args.errbars = list(from=VADeaths-2, to=VADeaths+2, mid=VADeaths,
+                             pch="|", col.pch=hred, cex=1.3, lwd=8, code=0, col=hgreen))
>
> # Error bars for binomial confidence intervals
> tab <- table(d.pizza$driver, d.pizza$wine_delivered)
> xci <- SetRowNames(BinomCI(tab[,1], rowSums(tab)), rownames(tab))
> PlotDot(xci[,1], main="wine delivered ~ driver ", xlim=c(0,1),
+         args.errbars=list(from=xci[,-1], mid=xci[,1], pch=21))
>
>
> # Error bars for confidence intervals for means
> xci <- do.call(rbind, tapply(d.pizza$delivery_min, d.pizza$driver,
+   MeanCI, conf.level=0.99, na.rm=TRUE))
>
> PlotDot(xci[,1], main="delivery_min ~ driver",
+   args.errbars=list(from=xci[,-1]))
>
> # Setting the colours
> PlotDot(VADeaths, main="This should only show how to set the colours, not be pretty",
+         col=c("red", "blue"), pch=NA, gcolor = "green", lcolor = "orange",
+         args.errbars = list(from=VADeaths-2, to=VADeaths+2, mid=VADeaths,
+                           pch=21, cex=1.4, col="blue", col.pch="green", bg.pch="red"))
>
>
>
>
>
>
> dev.off()
null device
          1
>
|