Supported by Dr. Osamu Ogasawara and  . . |
|
Last data update: 2014.03.03 |
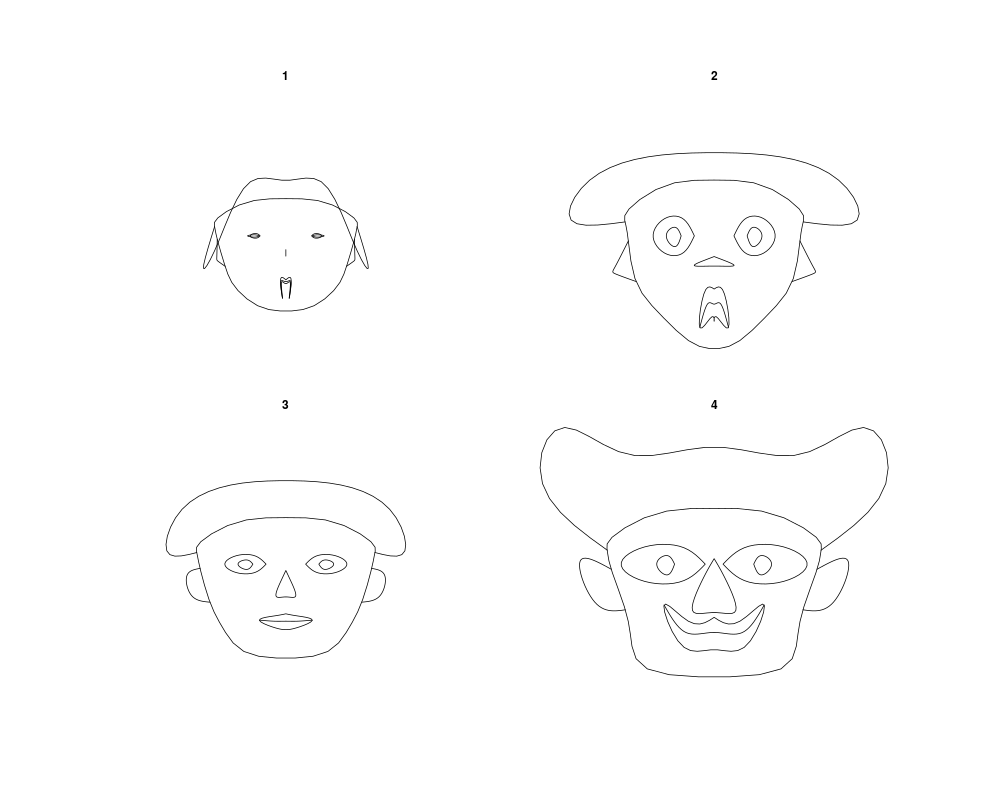
Chernoff FacesDescriptionPlot Chernoff faces. The rows of a data matrix represent cases and the columns the variables. Usage
PlotFaces(xy, which.row, fill = FALSE, nrow, ncol,
          scale = TRUE, byrow = FALSE, main, labels, print.info=FALSE, col=NA)
Arguments
DetailsThe features paramters of this implementation are:
For details look at the literate program of Valuea plot of faces is created on the graphics device, no numerical results Noteversion 12/2003 Author(s)H. P. Wolf References Chernoff, H. (1973) The use of faces to represent statistiscal assoziation,
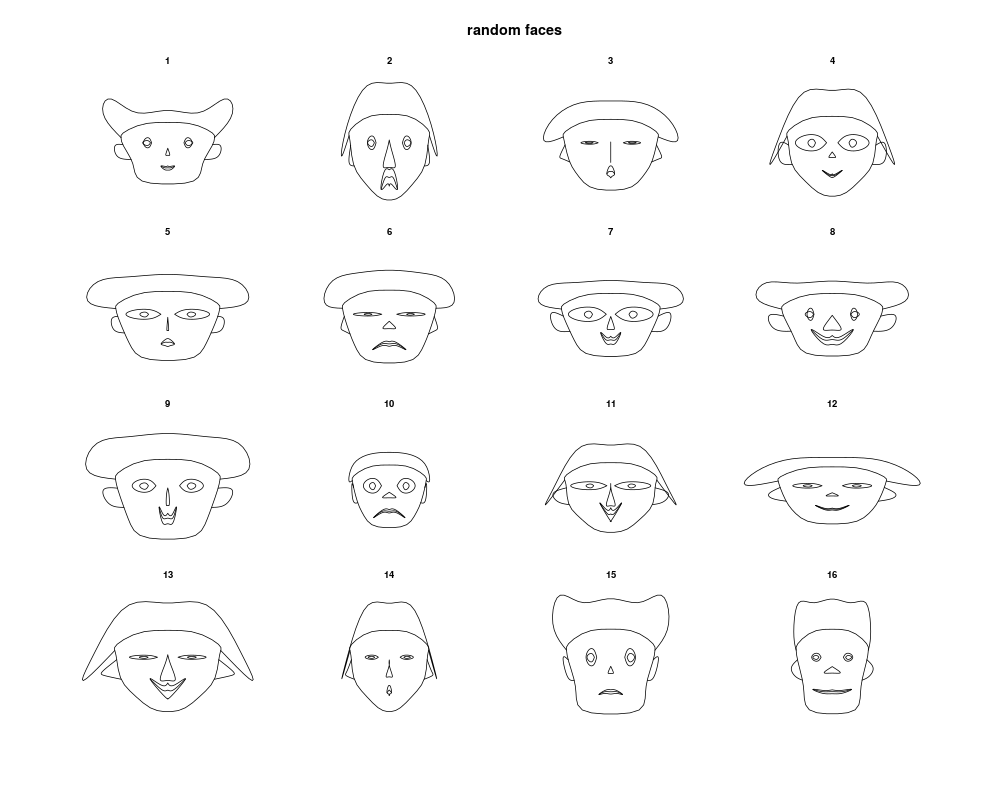
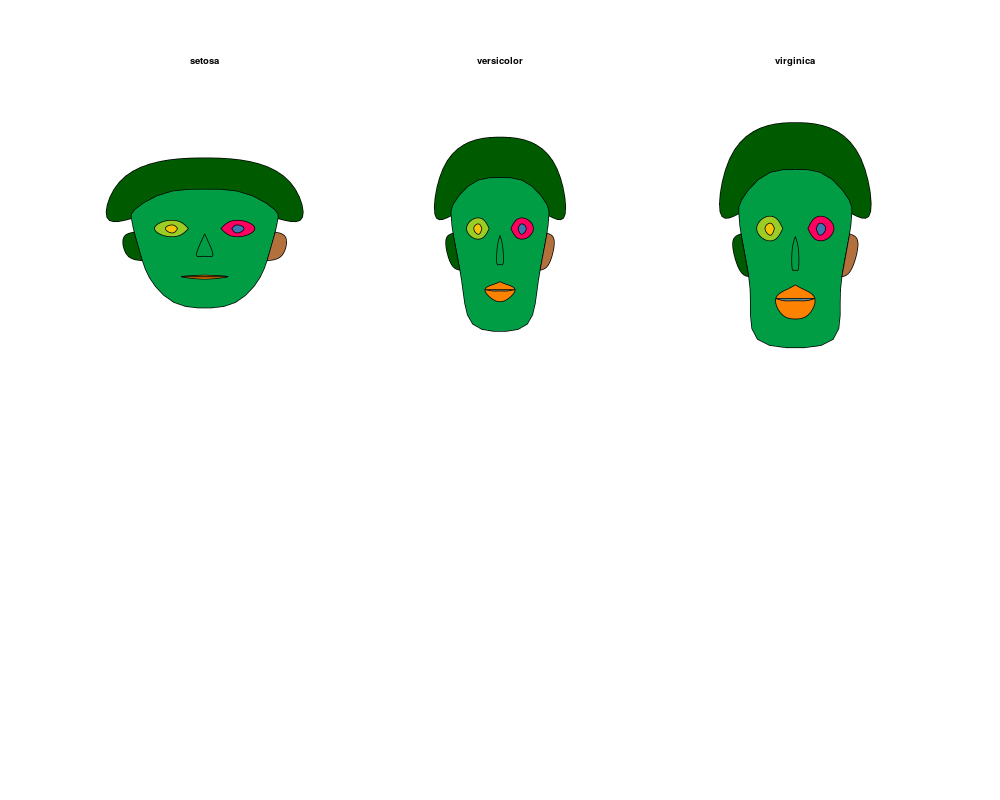
JASA, 68, pp 361–368. The smooth curves are computed by an algorithm found in: ExamplesPlotFaces(rbind(1:3,5:3,3:5,5:7)) data(longley) PlotFaces(longley[1:9,]) set.seed(17) PlotFaces(matrix(sample(1:1000,128,),16,8),main="random faces") means <- lapply(iris[,-5], tapply, iris$Species, mean) m <- t(do.call(rbind, means)) m <- cbind(m, matrix(rep(1, 11*3), nrow=3)) PlotFaces(m, ncol=3, col=PalTibco()) Results
R version 3.3.1 (2016-06-21) -- "Bug in Your Hair"
Copyright (C) 2016 The R Foundation for Statistical Computing
Platform: x86_64-pc-linux-gnu (64-bit)

R is free software and comes with ABSOLUTELY NO WARRANTY.
You are welcome to redistribute it under certain conditions.
Type 'license()' or 'licence()' for distribution details.

R is a collaborative project with many contributors.
Type 'contributors()' for more information and
'citation()' on how to cite R or R packages in publications.

Type 'demo()' for some demos, 'help()' for on-line help, or
'help.start()' for an HTML browser interface to help.
Type 'q()' to quit R.

> library(DescTools)
> png(filename="/home/ddbj/snapshot/RGM3/R_CC/result/DescTools/PlotFaces.Rd_%03d_medium.png", width=480, height=480)
> ### Name: PlotFaces
> ### Title: Chernoff Faces
> ### Aliases: PlotFaces
> ### Keywords: hplot
>
> ### ** Examples
>
> PlotFaces(rbind(1:3,5:3,3:5,5:7))
>
> data(longley)
> PlotFaces(longley[1:9,])
>
> set.seed(17)
> PlotFaces(matrix(sample(1:1000,128,),16,8),main="random faces")
>
>
> means <- lapply(iris[,-5], tapply, iris$Species, mean)
> m <- t(do.call(rbind, means))
> m <- cbind(m, matrix(rep(1, 11*3), nrow=3))
>
> PlotFaces(m, ncol=3, col=PalTibco())
>
>
>
>
>
> dev.off()
null device
          1
>
|