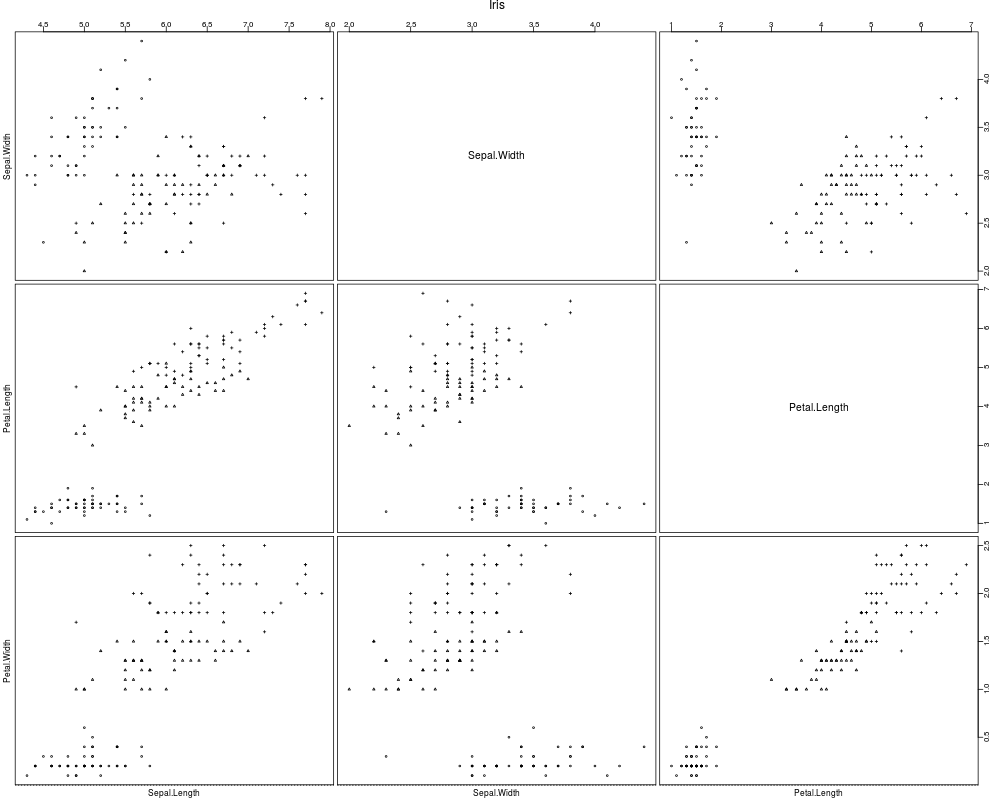
Plots a scatterplot matrix, for which the variables shown horizontally
do not necessarily coincide with those shown vertically. If desired,
the matrix is divided into several blocks such that it fills more than
1 plot page.
data for columns (x axis), or formula defining column
variables. If it is a formula containing a left hand side,
the left side variables will be used last.
y
data or formula for rows (y axis). Defaults to x
data
data.frame containing the variables in case x
or y is a formula
panel
a function that generates the marks of the individual
panels, see Details.
Defaults essentially to points or text
depending on the argument pch
nrows
number of rows of panels on a page
ncols
number of columns of panels on a page
save
if y is not provided and save==TRUE,
the first row and the last column are suppressed.
robrange.
if TRUE, robust plot ranges will be used
range.
plot ranges, given as a matrix with 2 rows (min, max)
and colnames identifying the variables.
pch
plotting character. A vector of integers, characters or
strings can also be given for the default panel function
col
color(s) to be used for plotting the observations
reference
coordinates for reference lines to be shown in the
panels. A named vector can be used to define a value for each or
any variable.
ltyref
line type for reference lines
log
specifies logarithmic scale of axes. "x" asks for
log scale on horizontal axis, "y", on vertical axis,
"xy", on both axes.
xaxs, yaxs
styles for x and y axis, see par
xaxmar, yaxmar
in which margin should the x- [y-] axis be
labelled?
vnames
labels for the variables
main
main title for the plot (to be repeated on each plot page)
cex.points
character expansion for showing the observations
cex.lab, cex.text
character expansion for variable labels
in the margin and in the "diagonal", respectively,
relative to cex
cex.title
character expansion for the main title
bty
box type for each panel, see par
oma
width of outer margins, ee par
...
further arguments passed to the panel function
Details
If x or y is a data.frame, it is converted to a
numerical matrix.
The panel function can be user written. It needs >=6 arguments,
which are given:
the values of the horizontal variable,
the values of the vertical variable,
the index of the variable shown horizontally, among the
y variables,
the index of the variable shown vertically, among the
x variables,
argument pch, and
argument col
Since large scatterplot matrices lead to tiny panels, PlotMatrix
splits the matrix into blocks of at most nrows rows and
ncols columns. If these numbers are missing, they default to
nrows=5 and ncols=6 for landscape pages, and to
nrows=8 and ncols=5 for portrait pages.
R version 3.3.1 (2016-06-21) -- "Bug in Your Hair"
Copyright (C) 2016 The R Foundation for Statistical Computing
Platform: x86_64-pc-linux-gnu (64-bit)

R is free software and comes with ABSOLUTELY NO WARRANTY.
You are welcome to redistribute it under certain conditions.
Type 'license()' or 'licence()' for distribution details.

R is a collaborative project with many contributors.
Type 'contributors()' for more information and
'citation()' on how to cite R or R packages in publications.

Type 'demo()' for some demos, 'help()' for on-line help, or
'help.start()' for an HTML browser interface to help.
Type 'q()' to quit R.

> library(DescTools)
> png(filename="/home/ddbj/snapshot/RGM3/R_CC/result/DescTools/PlotMatrix.Rd_%03d_medium.png", width=480, height=480)
> ### Name: PlotMatrix
> ### Title: Scatterplot Matrix
> ### Aliases: PlotMatrix
> ### Keywords: hplot
>
> ### ** Examples
>
> PlotMatrix(iris[,1:4], main="Iris", pch=as.numeric(iris[,"Species"]))
[1] "PlotMatrix: done"
>
>
>
>
>
> dev.off()
null device
          1
>
 .
.