Supported by Dr. Osamu Ogasawara and  . . |
|
Last data update: 2014.03.03 |
Mosaic PlotsDescriptionPlots a mosaic on the current graphics device. Usage
PlotMosaic(x, main = deparse(substitute(x)), horiz = TRUE, cols = NULL,
           off = 0.02, mar = NULL, xlab = NULL, ylab = NULL,
           cex = par("cex"), las = 2, ...)
Arguments
DetailsThe reason for this function to exist are the unsatisfying labels in base mosaicplot. Valuelist with the midpoints of the rectangles Author(s)Andri Signorell <andri@signorell.net> ReferencesFriendly, M. (1994) Mosaic displays for multi-way contingency tables. Journal of the American Statistical Association, 89, 190-200. See Also
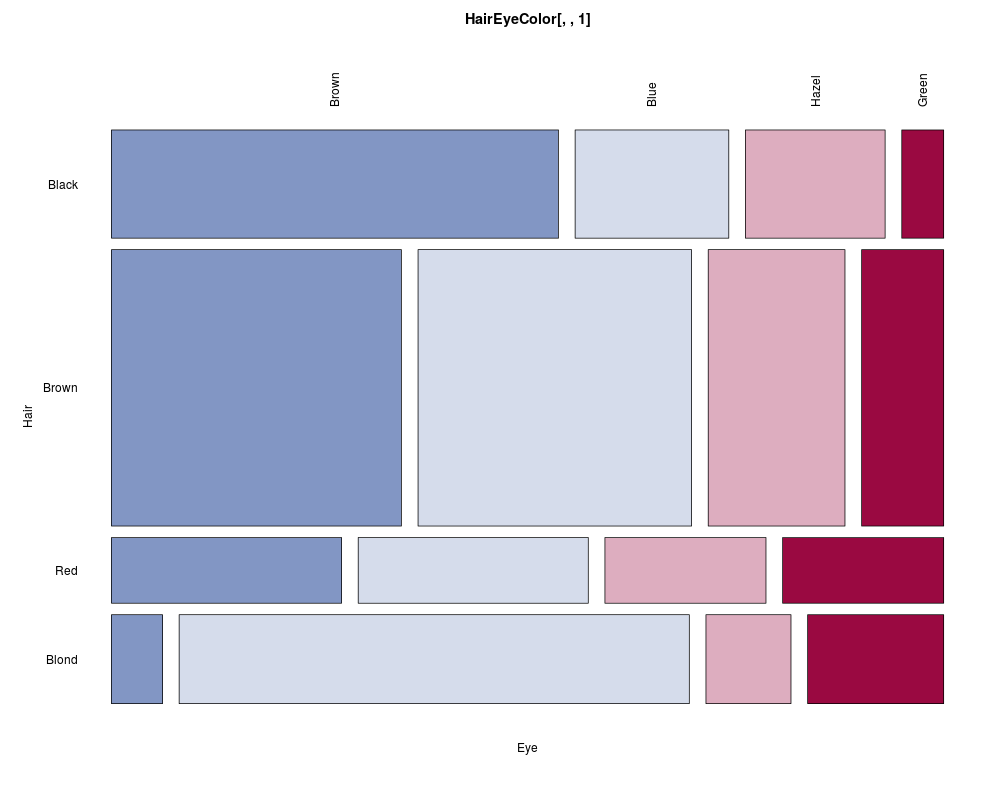
ExamplesPlotMosaic(HairEyeColor[,,1]) Results
R version 3.3.1 (2016-06-21) -- "Bug in Your Hair"
Copyright (C) 2016 The R Foundation for Statistical Computing
Platform: x86_64-pc-linux-gnu (64-bit)

R is free software and comes with ABSOLUTELY NO WARRANTY.
You are welcome to redistribute it under certain conditions.
Type 'license()' or 'licence()' for distribution details.

R is a collaborative project with many contributors.
Type 'contributors()' for more information and
'citation()' on how to cite R or R packages in publications.

Type 'demo()' for some demos, 'help()' for on-line help, or
'help.start()' for an HTML browser interface to help.
Type 'q()' to quit R.

> library(DescTools)
> png(filename="/home/ddbj/snapshot/RGM3/R_CC/result/DescTools/PlotMosaic.Rd_%03d_medium.png", width=480, height=480)
> ### Name: PlotMosaic
> ### Title: Mosaic Plots
> ### Aliases: PlotMosaic
> ### Keywords: hplot
>
> ### ** Examples
>
> PlotMosaic(HairEyeColor[,,1])
>
>
>
>
>
> dev.off()
null device
          1
>
|