Supported by Dr. Osamu Ogasawara and  . . |
|
Last data update: 2014.03.03 |
Plot Violins Instead of BoxplotsDescriptionThis function serves the same utility as side-by-side boxplots, only it provides more detail about the different distribution. It plots violins instead of boxplots. That is, instead of a box, it uses the density function to plot the density. For skewed distributions, the results look like "violins". Hence the name. Usage
PlotViolin(x, ...)

## Default S3 method:
PlotViolin(x, ..., horizontal = FALSE, bw = "SJ", na.rm = FALSE,
           names = NULL, args.boxplot = NULL)

## S3 method for class 'formula'
PlotViolin(formula, data, subset, na.action, ...)
Arguments
ValueIf a boxplot was drawn then the function returns a list with the following components:
Note This function is based on Author(s)John Verzani, Andri Signorell <andri@signorell.net> ReferencesThe code is based on the boxplot function from R/base. See Also
Examples
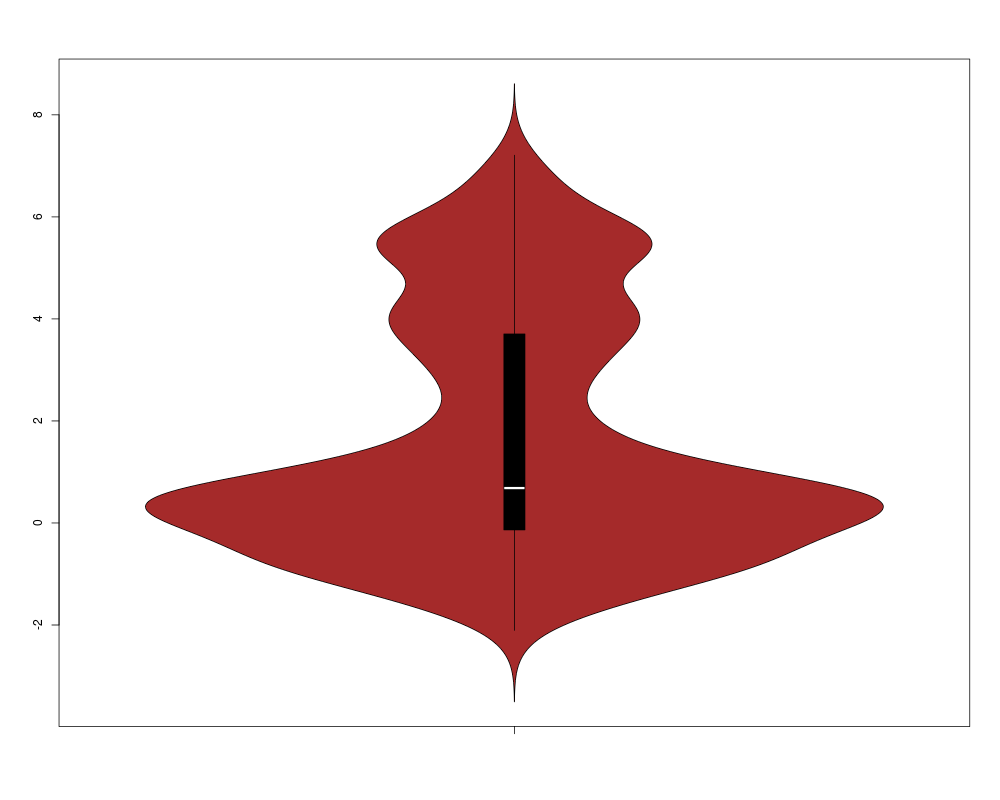
# make a "violin"
x <- c(rnorm(100), rnorm(50,5))
PlotViolin(x, col = "brown")
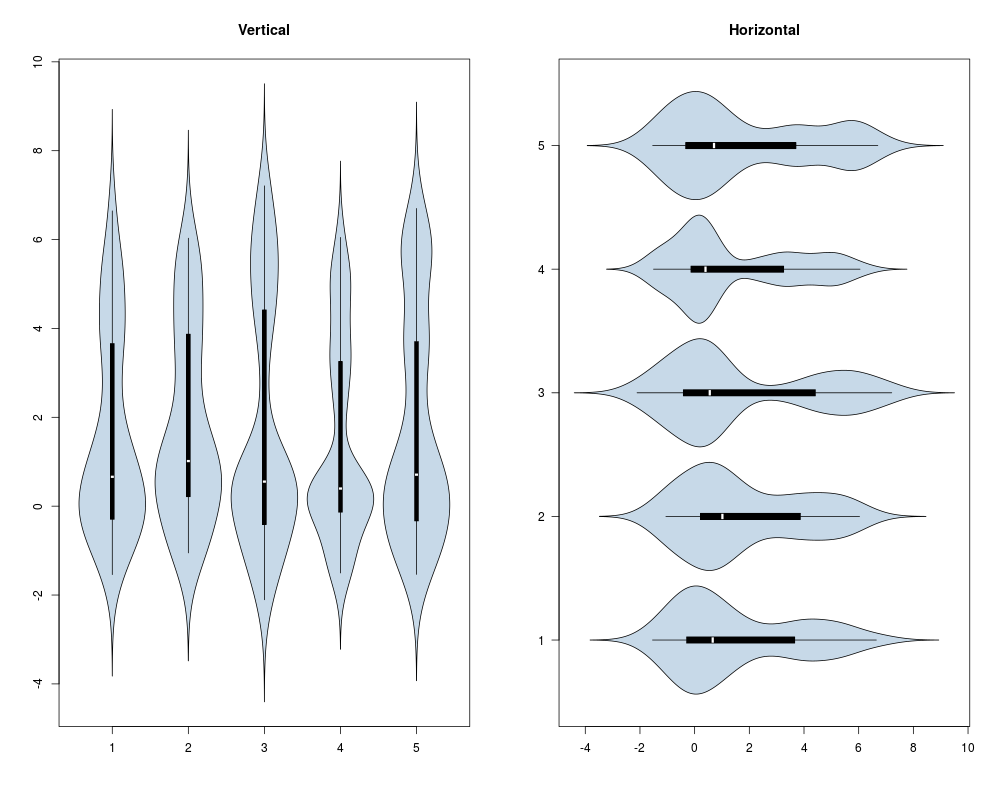
par(mfrow=c(1,2))
f <- factor(rep(1:5, 30))
# make a quintet. Note also choice of bandwidth
PlotViolin(x ~ f, col = SetAlpha("steelblue",0.3), bw = "SJ", main="Vertical")
# and the same, but in horizontal arrangement
PlotViolin(x ~ f, col = SetAlpha("steelblue",0.3), bw = "SJ", horizontal = TRUE,
las=1, main="Horizontal")
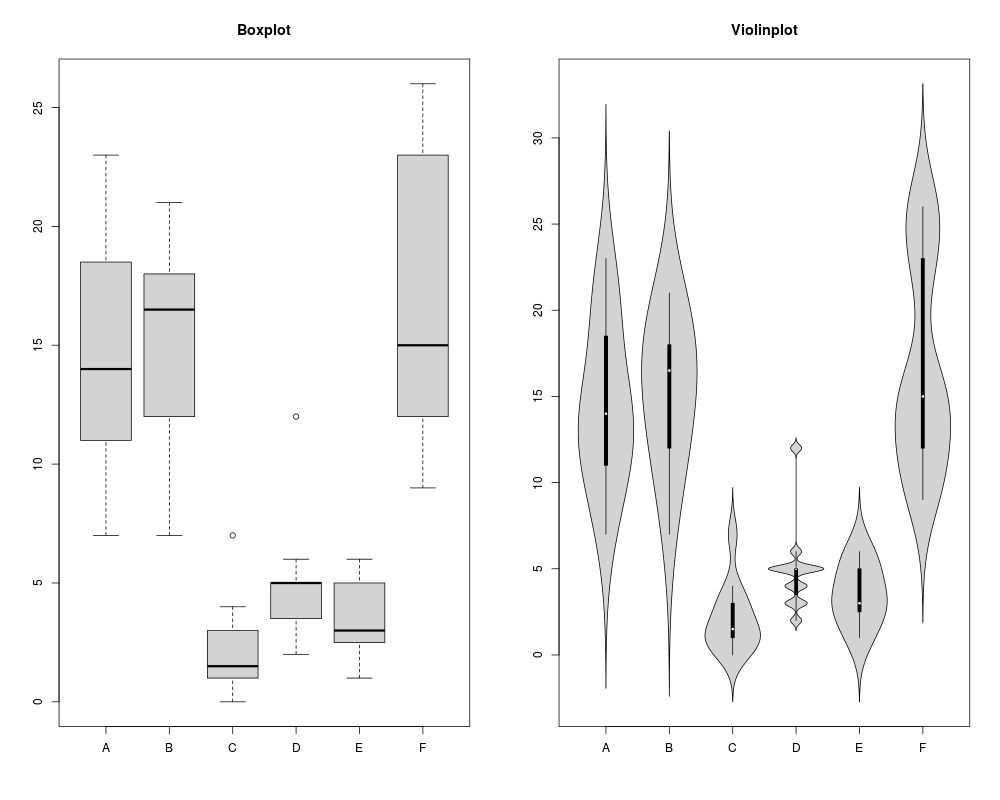
# example taken from boxplot
boxplot(count ~ spray, data = InsectSprays, col = "lightgray", main="Boxplot")
PlotViolin(count ~ spray, data = InsectSprays, col = "lightgray", main="Violinplot")
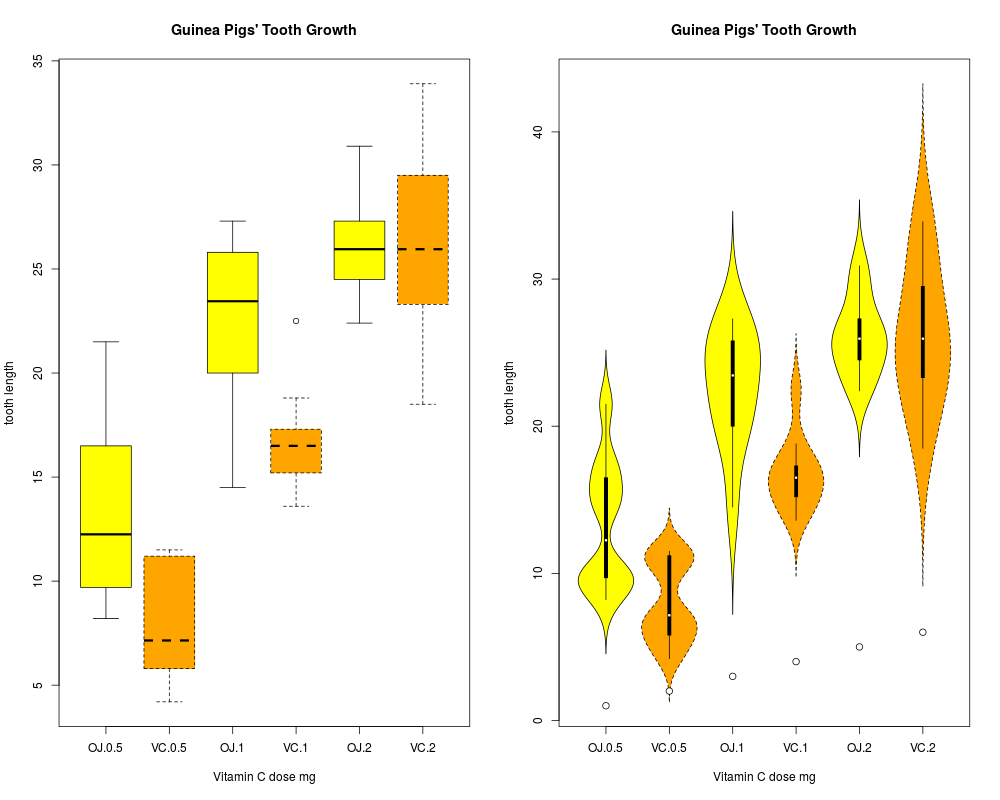
# groupwise densityplots defined the same way as in boxplot
boxplot(len ~ supp*dose, data = ToothGrowth,
main = "Guinea Pigs' Tooth Growth",
xlab = "Vitamin C dose mg", ylab = "tooth length",
col=c("yellow", "orange"), lty=c(1,2)
)
b <- PlotViolin(len ~ supp*dose, data = ToothGrowth,
main = "Guinea Pigs' Tooth Growth",
xlab = "Vitamin C dose mg", ylab = "tooth length",
col=c("yellow", "orange"), lty=c(1,2)
)
# use points, if the medians deserve special attention
points(x=1:6, y=b$stats[3,], pch=21, bg="white", col="black", cex=1.2)
Results
R version 3.3.1 (2016-06-21) -- "Bug in Your Hair"
Copyright (C) 2016 The R Foundation for Statistical Computing
Platform: x86_64-pc-linux-gnu (64-bit)

R is free software and comes with ABSOLUTELY NO WARRANTY.
You are welcome to redistribute it under certain conditions.
Type 'license()' or 'licence()' for distribution details.

R is a collaborative project with many contributors.
Type 'contributors()' for more information and
'citation()' on how to cite R or R packages in publications.

Type 'demo()' for some demos, 'help()' for on-line help, or
'help.start()' for an HTML browser interface to help.
Type 'q()' to quit R.

> library(DescTools)
> png(filename="/home/ddbj/snapshot/RGM3/R_CC/result/DescTools/PlotViolin.Rd_%03d_medium.png", width=480, height=480)
> ### Name: PlotViolin
> ### Title: Plot Violins Instead of Boxplots
> ### Aliases: PlotViolin PlotViolin.default PlotViolin.formula
> ### Keywords: multivariate hplot
>
> ### ** Examples
>
> # make a "violin"
> x <- c(rnorm(100), rnorm(50,5))
>
> PlotViolin(x, col = "brown")
>
> par(mfrow=c(1,2))
> f <- factor(rep(1:5, 30))
> # make a quintet. Note also choice of bandwidth
> PlotViolin(x ~ f, col = SetAlpha("steelblue",0.3), bw = "SJ", main="Vertical")
>
> # and the same, but in horizontal arrangement
> PlotViolin(x ~ f, col = SetAlpha("steelblue",0.3), bw = "SJ", horizontal = TRUE,
+   las=1, main="Horizontal")
>
>
> # example taken from boxplot
> boxplot(count ~ spray, data = InsectSprays, col = "lightgray", main="Boxplot")
> PlotViolin(count ~ spray, data = InsectSprays, col = "lightgray", main="Violinplot")
>
>
> # groupwise densityplots defined the same way as in boxplot
> boxplot(len ~ supp*dose, data = ToothGrowth,
+         main = "Guinea Pigs' Tooth Growth",
+         xlab = "Vitamin C dose mg", ylab = "tooth length",
+         col=c("yellow", "orange"), lty=c(1,2)
+ )
>
> b <- PlotViolin(len ~ supp*dose, data = ToothGrowth,
+            main = "Guinea Pigs' Tooth Growth",
+            xlab = "Vitamin C dose mg", ylab = "tooth length",
+            col=c("yellow", "orange"), lty=c(1,2)
+ )
> # use points, if the medians deserve special attention
> points(x=1:6, y=b$stats[3,], pch=21, bg="white", col="black", cex=1.2)
>
>
>
>
>
> dev.off()
null device
          1
>
|