Supported by Dr. Osamu Ogasawara and  . . |
|
Last data update: 2014.03.03 |
Plot a Grid in Polar CoordinatesDescription
Usage
PolarGrid(nr = NULL, ntheta = NULL, col = "lightgray", lty = "dotted", lwd = par("lwd"),
          rlabels = NULL, alabels = NULL, lblradians = FALSE)
Arguments
DetailsThis can be made better.... Author(s)Andri Signorell <andri@signorell.net> See Also
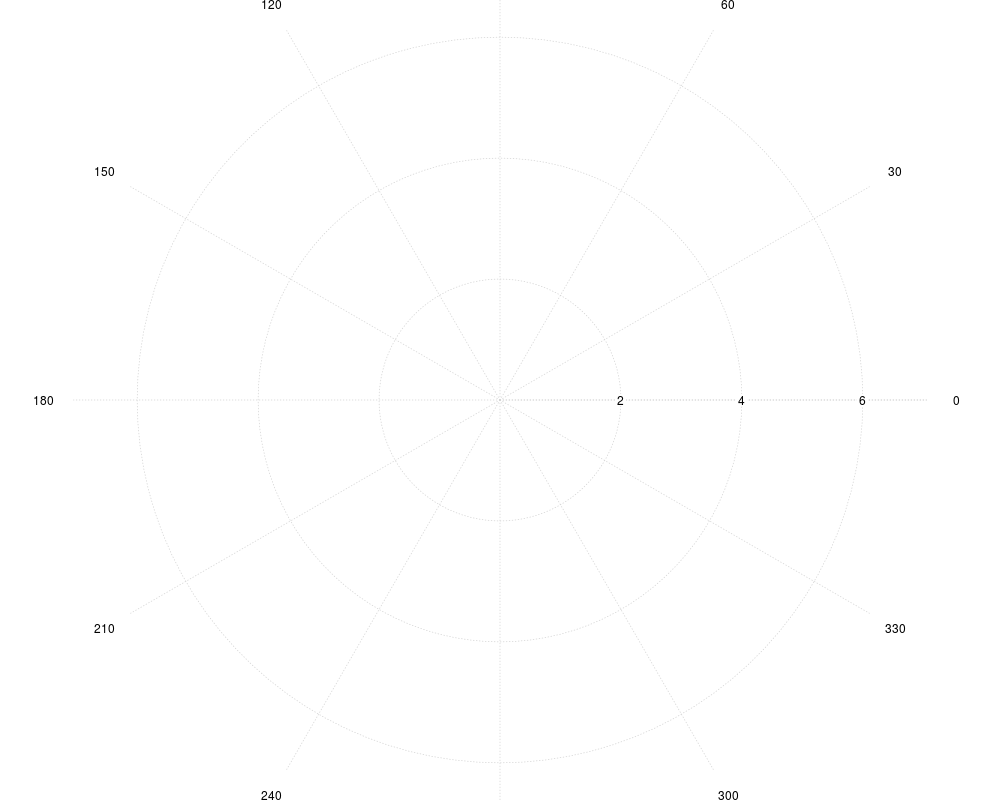
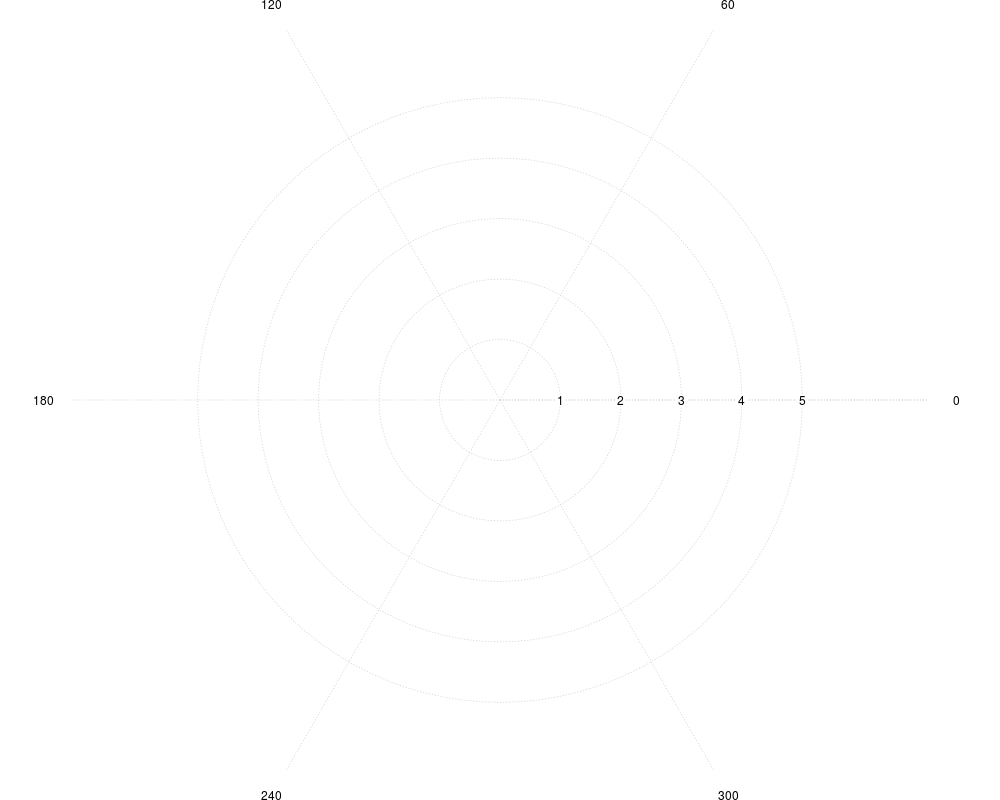
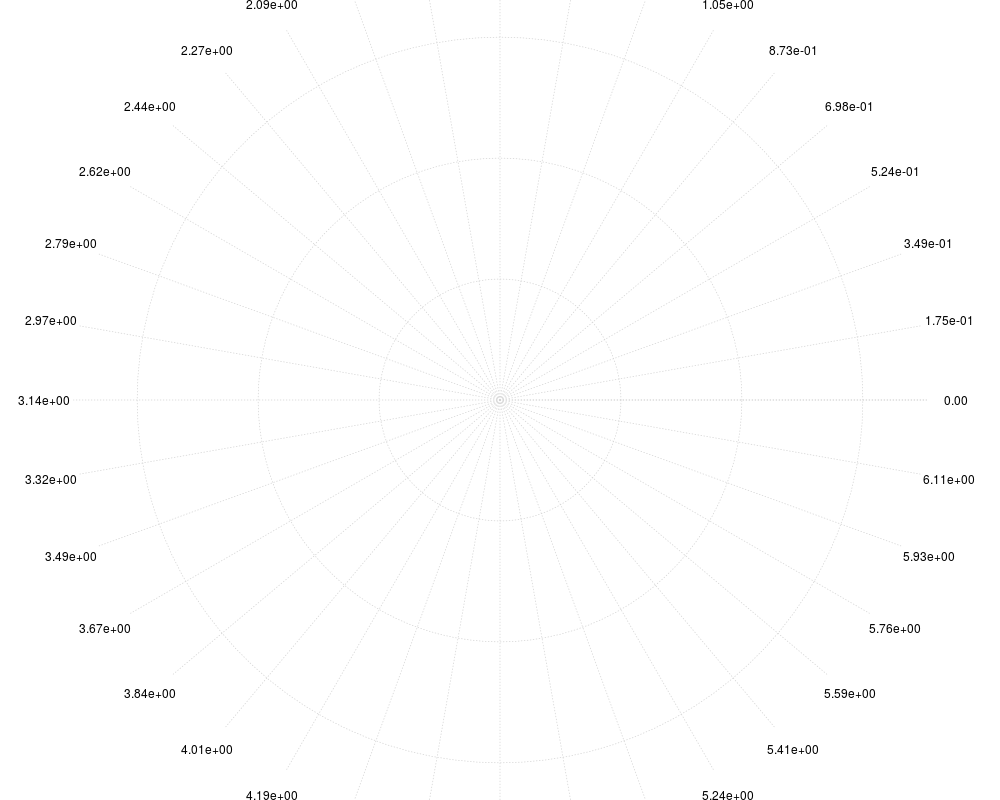
ExamplesCanvas(xlim=c(-5,5), xpd=TRUE) PolarGrid() Canvas(xlim=c(-5,5), xpd=TRUE) PolarGrid(nr=0:5, ntheta=6) Canvas(xlim=c(-5,5), xpd=TRUE) PolarGrid(ntheta=36, rlabels=NA, lblradians=TRUE) Results
R version 3.3.1 (2016-06-21) -- "Bug in Your Hair"
Copyright (C) 2016 The R Foundation for Statistical Computing
Platform: x86_64-pc-linux-gnu (64-bit)

R is free software and comes with ABSOLUTELY NO WARRANTY.
You are welcome to redistribute it under certain conditions.
Type 'license()' or 'licence()' for distribution details.

R is a collaborative project with many contributors.
Type 'contributors()' for more information and
'citation()' on how to cite R or R packages in publications.

Type 'demo()' for some demos, 'help()' for on-line help, or
'help.start()' for an HTML browser interface to help.
Type 'q()' to quit R.

> library(DescTools)
> png(filename="/home/ddbj/snapshot/RGM3/R_CC/result/DescTools/PolarGrid.Rd_%03d_medium.png", width=480, height=480)
> ### Name: PolarGrid
> ### Title: Plot a Grid in Polar Coordinates
> ### Aliases: PolarGrid
> ### Keywords: aplot
>
> ### ** Examples
>
> Canvas(xlim=c(-5,5), xpd=TRUE)
> PolarGrid()
>
> Canvas(xlim=c(-5,5), xpd=TRUE)
> PolarGrid(nr=0:5, ntheta=6)
>
> Canvas(xlim=c(-5,5), xpd=TRUE)
> PolarGrid(ntheta=36, rlabels=NA, lblradians=TRUE)
>
>
>
>
>
> dev.off()
null device
          1
>
|