Supported by Dr. Osamu Ogasawara and  . . |
|
Last data update: 2014.03.03 |
Compute Axis Tickmark Locations (For POSIXct Axis)DescriptionCompute pretty tickmark locations, the same way as R does internally. By default, gives the at values which axis.POSIXct(side, x) would use. UsageaxTicks.POSIXct(side, x, at, format, labels = TRUE, ...) Arguments
DetailsaxTicks has no implementation for POSIXct axis. This function fills the gap. Valuenumeric vector of coordinate values at which axis tickmarks can be drawn. Author(s)Andri Signorell <andri@signorell.net> simply copying R-Core code See Also
Examples
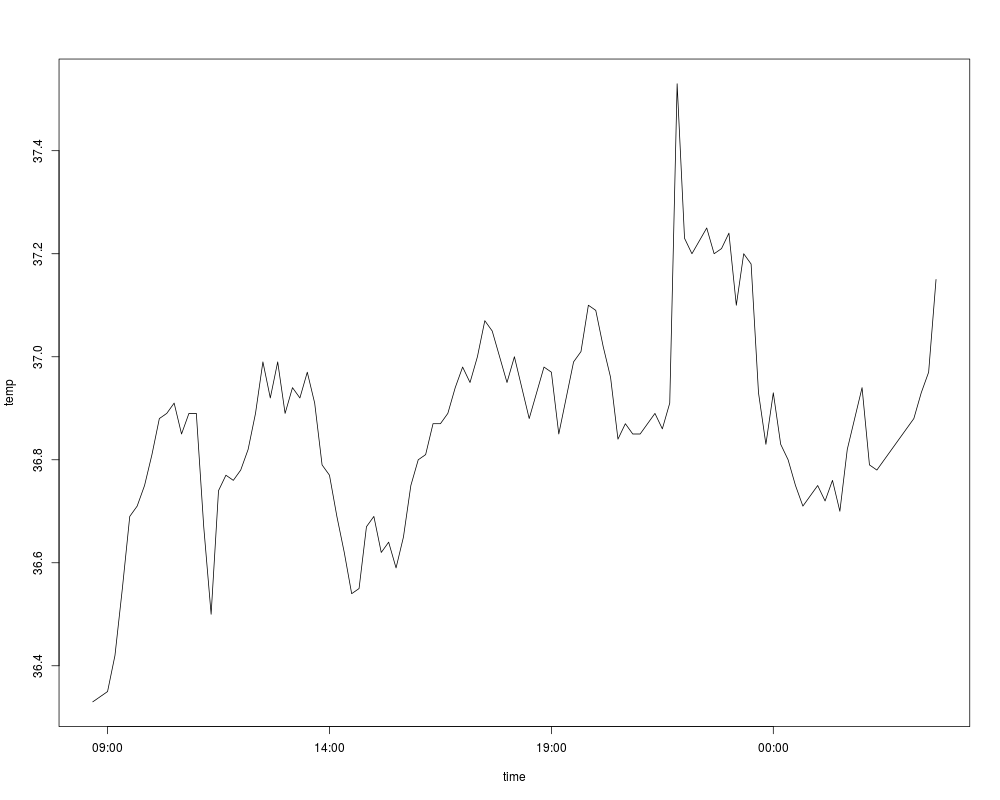
with(beaver1, {
time <- strptime(paste(1990, day, time %/% 100, time %% 100),
"%Y %j %H %M")
plot(time, temp, type = "l") # axis at 4-hour intervals.
# now label every hour on the time axis
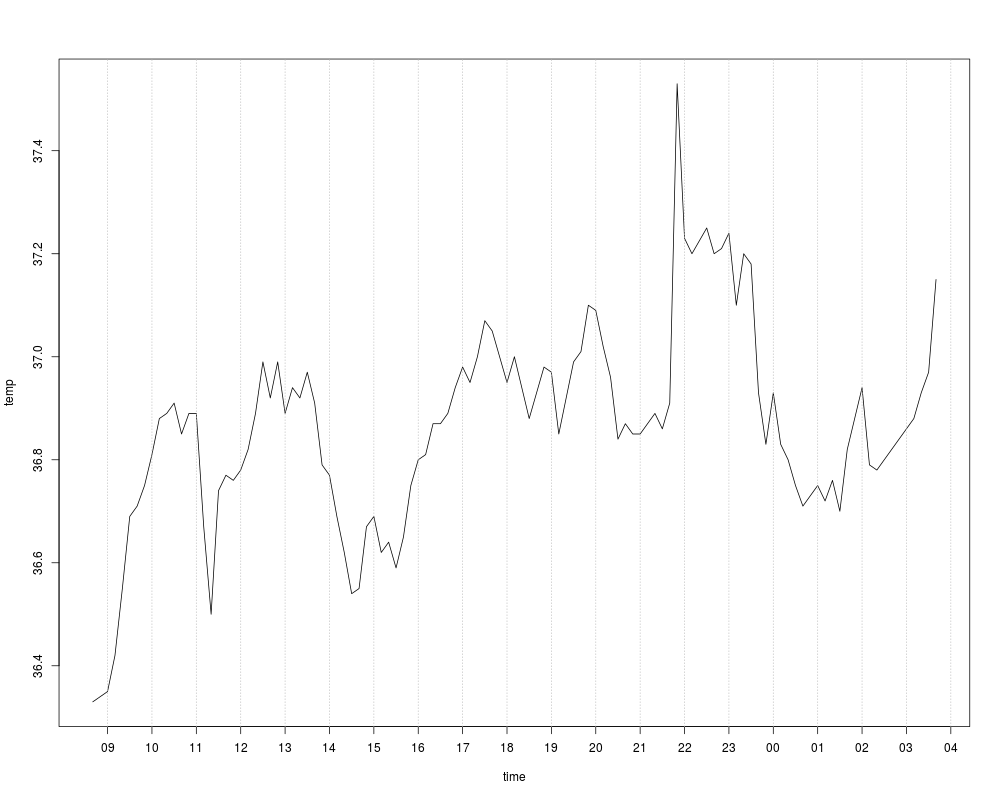
plot(time, temp, type = "l", xaxt = "n")
r <- as.POSIXct(round(range(time), "hours"))
axis.POSIXct(1, at = seq(r[1], r[2], by = "hour"), format = "%H")
# place the grid
abline(v=axTicks.POSIXct(1, at = seq(r[1], r[2], by = "hour"), format = "%H"),
col="grey", lty="dotted")
})
Results
R version 3.3.1 (2016-06-21) -- "Bug in Your Hair"
Copyright (C) 2016 The R Foundation for Statistical Computing
Platform: x86_64-pc-linux-gnu (64-bit)

R is free software and comes with ABSOLUTELY NO WARRANTY.
You are welcome to redistribute it under certain conditions.
Type 'license()' or 'licence()' for distribution details.

R is a collaborative project with many contributors.
Type 'contributors()' for more information and
'citation()' on how to cite R or R packages in publications.

Type 'demo()' for some demos, 'help()' for on-line help, or
'help.start()' for an HTML browser interface to help.
Type 'q()' to quit R.

> library(DescTools)
> png(filename="/home/ddbj/snapshot/RGM3/R_CC/result/DescTools/axTicks.POSIXct.Rd_%03d_medium.png", width=480, height=480)
> ### Name: axTicks.POSIXct
> ### Title: Compute Axis Tickmark Locations (For POSIXct Axis)
> ### Aliases: axTicks.POSIXct
> ### Keywords: aplot chron
>
> ### ** Examples
>
> with(beaver1, {
+   time <- strptime(paste(1990, day, time %/% 100, time %% 100),
+                    "%Y %j %H %M")
+   plot(time, temp, type = "l") # axis at 4-hour intervals.
+   # now label every hour on the time axis
+   plot(time, temp, type = "l", xaxt = "n")
+   r <- as.POSIXct(round(range(time), "hours"))
+   axis.POSIXct(1, at = seq(r[1], r[2], by = "hour"), format = "%H")
+   # place the grid
+   abline(v=axTicks.POSIXct(1, at = seq(r[1], r[2], by = "hour"), format = "%H"),
+          col="grey", lty="dotted")
+ })
>
>
>
>
>
>
> dev.off()
null device
          1
>
|
Created & Maintained by Osamu Ogasawara (osamu.ogasawara@gmail.com) and 