Supported by Dr. Osamu Ogasawara and  . . |
|
Last data update: 2014.03.03 |
Significance analysis of ERP dataDescriptionThe package provides multiple testing procedures designed for Event-Related Potentials (ERP) data in a linear model framework. These procedures are reviewed and compared in Sheu, Perthame, Lee and Causeur (2016). Some of the methods gathered in the package are the classical FDR- and FWER-controlling procedures, also available using function p.adjust. The package also implements the Guthrie-Buchwald procedure (Guthrie and Buchwald, 1991), which accounts for the auto-correlation among t-tests to control erroneous detections of short intervals. The Adaptive Factor-Adjustment method is an extension of the method described in Causeur, Chu, Hsieh and Sheu (2012). It assumes a factor model for the correlation among tests and combines adptatively the estimation of the signal and the updtating of the dependence modelling (see Sheu et al., 2016 for further details). Details
Apart from the function erpplot, which is just a wrapper for matplot to display the ERP curves, all the functions in the package implement multiple testing procedures of ERP data in a linear model framework (F-tests for the comparison of two nested models). The function gbtest implements the Guthrie-Buchwald procedure (see Guthrie and Buchwald, 1991). The function erptest can be used for the classical FDR- and FWER-controlling multiple testing of ERP data: especially the Benjamini-Hochberg (see Benjamini and Hochberg, 1995) and Benjamini-Yekutieli (see Benjamini and Yekutieli, 2001) procedures, with the possible extension proposed by Storey and Tibshirani (2003) including a non-parametric estimation of the proportion of true nulls. The function erpavetest first partition of the entire interval of ERP observations into a predetermined number equally-spaced intervals before performing siginificance testing using the averaged ERPs. Author(s)David Causeur, (Agrocampus, Rennes, France), Ching-Fan Sheu (National Cheng Kung University, Tainan, Taiwan), and Mei-Chen Chu (National Cheng Kung University, Tainan, Taiwan) Maintainer: David Causeur, http://math.agrocampus-ouest.fr/infoglueDeliverLive/membres/david.causeur, mailto: david.causeur@agrocampus-ouest.fr ReferencesBenjamini, Y., and Hochberg, Y. (1995). Controlling the false discovery rate: a practical and powerful approach to multiple testing. Journal of the Royal Statistical Society Series B, 289-300. Benjamini, Y., and Yekutieli, D. (2001). The control of the false discovery rate in multiple testing under dependency. Annals of Statistics 29, 1165-1188. Causeur, D., Chu, M.-C., Hsieh, S. and Sheu, C.-F. (2012). A factor-adjusted multiple testing procedure for ERP data analysis. Behavior Research Methods, 44, 635-643. Friguet, C., Kloareg, M. and Causeur, D. (2009). A factor model approach to multiple testing under dependence. Journal of the American Statistical Association, 104, 1406-1415. Guthrie, D. and Buchwald, J.S. (1991). Significance testing of difference potentials. Psychophysiology, 28, 240-244. Holm, S. (1979). A simple sequentially rejective multiple test procedure. Scandinavian Journal of Statistics, 6, 65-70. Hommel, G. (1988). A stagewise rejective multiple test procedure based on a modified Bonferroni test. Biometrika, 75, 383-386. Hochberg, Y. (1988). A sharper Bonferroni procedure for multiple tests of significance. Biometrika, 75, 800-803. Shaffer, J. P. (1995). Multiple hypothesis testing. Annual Review of Psychology, 46, 561-576. Sarkar, S. (1998). Some probability inequalities for ordered MTP2 random variables: a proof of Simes conjecture. Annals of Statistics, 26, 494-504. Sarkar, S., and Chang, C. K. (1997). Simes' method for multiple hypothesis testing with positively dependent test statistics. Journal of the American Statistical Association, 92, 1601-1608. Sheu, C.-F., Perthame, E., Lee Y.-S. and Causeur, D. (2016). Accounting for time dependence in large-scale multiple testing of event-related potentials data. To appear in Annals of Applied Statistics. Wright, S. P. (1992). Adjusted P-values for simultaneous inference. Biometrics, 48, 1005-1013. Examples
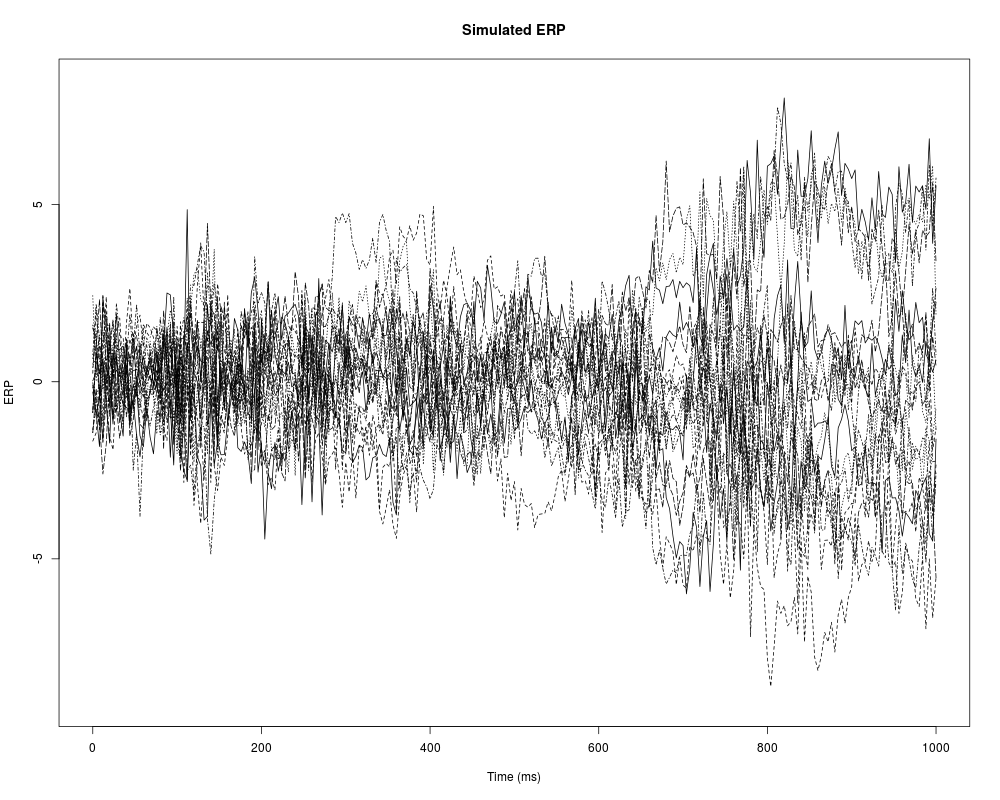
### simulated ERPs for 20 subjects (rows) and 251 ERPs measured at
### every 4 milliseconds plus a behavior score (columns)
data(simerp)
### Plot raw ERP curves
erpplot(simerp[,1:251],frames=seq(0,1001,4),xlab="Time (ms)",
ylab=expression(ERP),col="black",main="Simulated ERP")
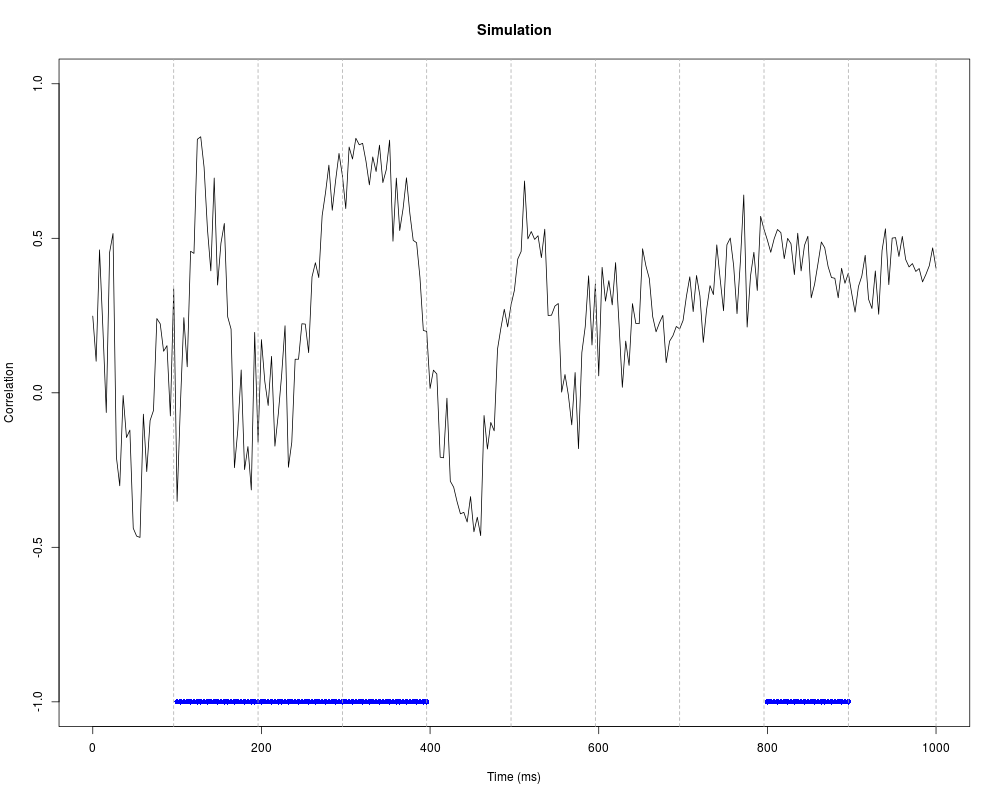
### Test of averaged ERPs over a pre-determined number of equal intervals
frames = seq(0,1001,4)
tests = erpavetest(simerp[,1:251],design=model.matrix(~y,data=simerp))
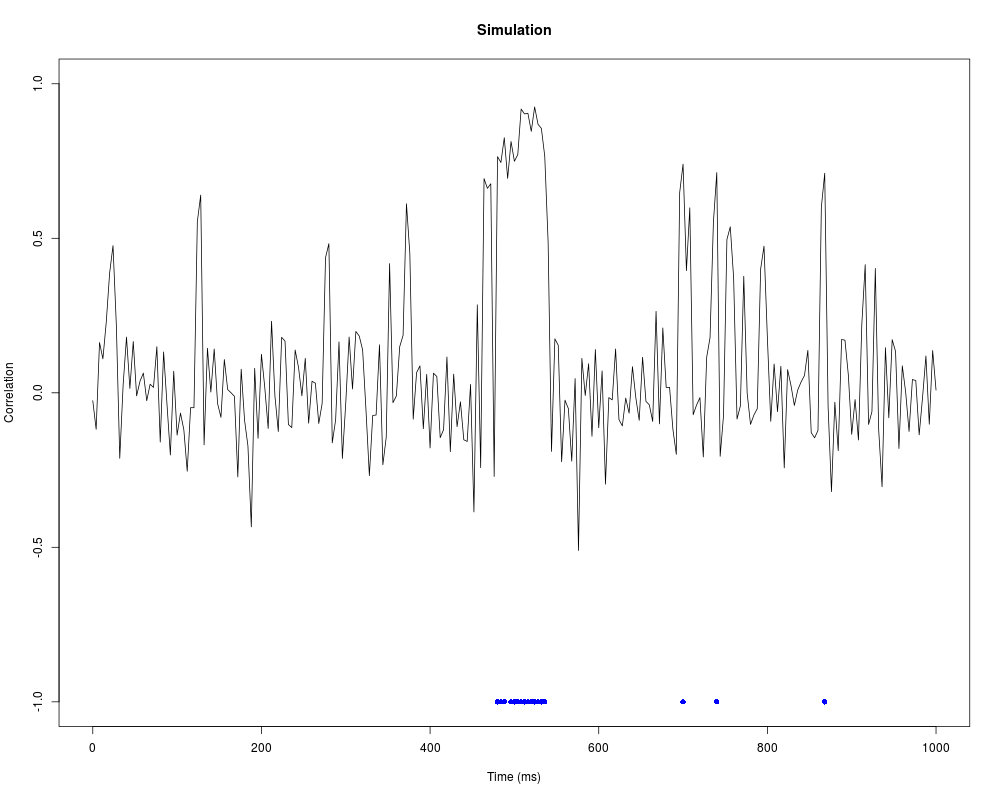
plot(frames,sign(tests$signal)*sqrt(tests$r2),type="l",
xlab="Time (ms)",ylab="Correlation",ylim=c(-1,1))
points(frames[tests$significant],rep(-1,length(tests$significant)),
pch=16,col="blue")
abline(v=frames[tests$breaks],lty=2,col="darkgray")
title("Simulation")
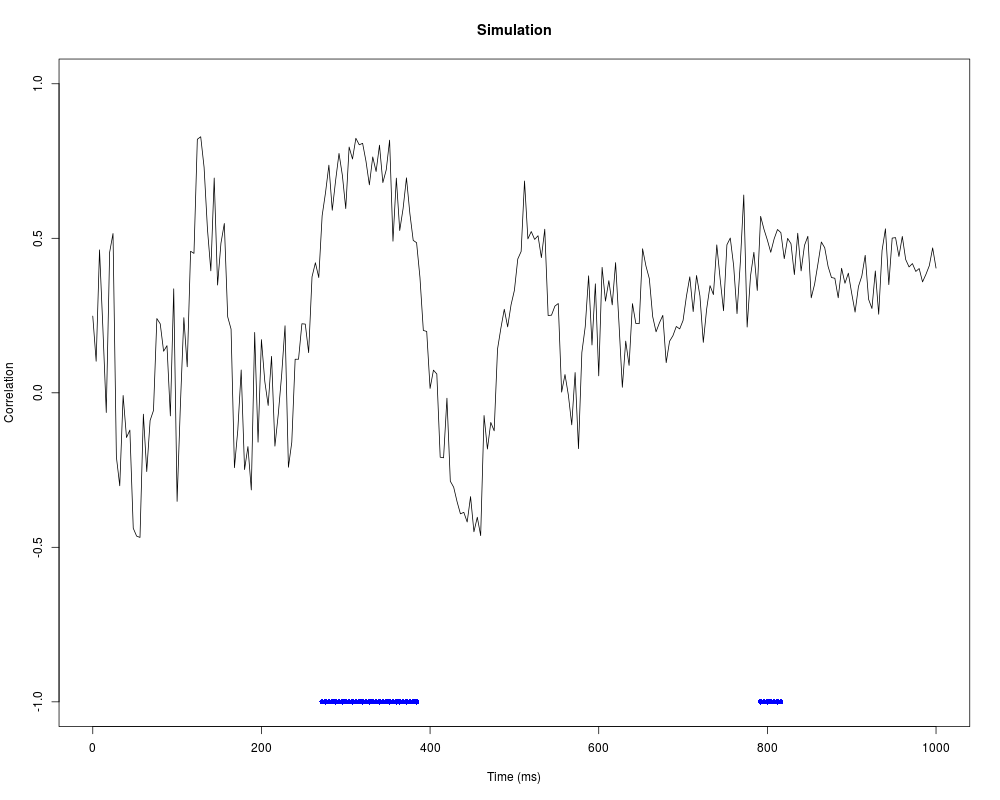
### Guthrie-Buchwald test
tests = gbtest(simerp[,1:251],design=model.matrix(~y,data=simerp),nbsamples=500)
plot(frames,sign(tests$signal)*sqrt(tests$r2),type="l",xlab="Time (ms)",
ylab="Correlation",ylim=c(-1,1))
points(frames[tests$significant],rep(-1,length(tests$significant)),
pch=16,col="blue")
title("Simulation")
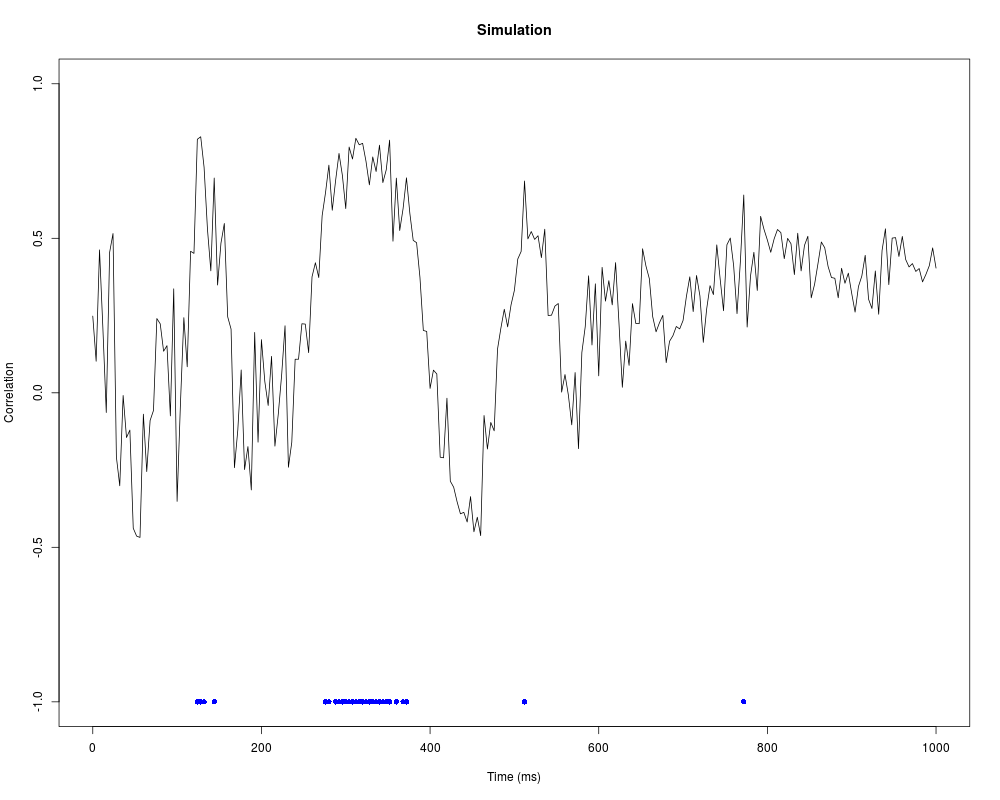
### Benjamini-Hochberg Significance testing
tests = erptest(simerp[,1:251],design=model.matrix(~y,data=simerp))
plot(frames,sign(tests$signal)*sqrt(tests$r2),type="l",xlab="Time (ms)",
ylab="Correlation",ylim=c(-1,1))
points(frames[tests$significant],rep(-1,length(tests$significant)),
pch=16,col="blue")
title("Simulation")
### AFA significance testing
tests = erpfatest(simerp[,1:251],design=model.matrix(~y,data=simerp),nbf=5,min.err=1e-01,maxiter=10)
plot(frames,sign(tests$signal)*sqrt(tests$r2),type="l",xlab="Time (ms)",
ylab="Correlation",ylim=c(-1,1))
points(frames[tests$significant],rep(-1,length(tests$significant)),
pch=16,col="blue")
title("Simulation")
Results
R version 3.3.1 (2016-06-21) -- "Bug in Your Hair"
Copyright (C) 2016 The R Foundation for Statistical Computing
Platform: x86_64-pc-linux-gnu (64-bit)

R is free software and comes with ABSOLUTELY NO WARRANTY.
You are welcome to redistribute it under certain conditions.
Type 'license()' or 'licence()' for distribution details.

R is a collaborative project with many contributors.
Type 'contributors()' for more information and
'citation()' on how to cite R or R packages in publications.

Type 'demo()' for some demos, 'help()' for on-line help, or
'help.start()' for an HTML browser interface to help.
Type 'q()' to quit R.

> library(ERP)
> png(filename="/home/ddbj/snapshot/RGM3/R_CC/result/ERP/ERP-package.Rd_%03d_medium.png", width=480, height=480)
> ### Name: ERP-package
> ### Title: Significance analysis of ERP data
> ### Aliases: ERP-package ERP
> ### Keywords: ERP package significance analysis
>
> ### ** Examples
>
>
> ### simulated ERPs for 20 subjects (rows) and 251 ERPs measured at
> ### every 4 milliseconds plus a behavior score (columns)
>
> data(simerp)
>
> ### Plot raw ERP curves
>
> erpplot(simerp[,1:251],frames=seq(0,1001,4),xlab="Time (ms)",
+    ylab=expression(ERP),col="black",main="Simulated ERP")
>
> ### Test of averaged ERPs over a pre-determined number of equal intervals
>
> frames = seq(0,1001,4)
>
> tests = erpavetest(simerp[,1:251],design=model.matrix(~y,data=simerp))
> plot(frames,sign(tests$signal)*sqrt(tests$r2),type="l",
+    xlab="Time (ms)",ylab="Correlation",ylim=c(-1,1))
> points(frames[tests$significant],rep(-1,length(tests$significant)),
+    pch=16,col="blue")
> abline(v=frames[tests$breaks],lty=2,col="darkgray")
> title("Simulation")
>
> ### Guthrie-Buchwald test
>
> tests = gbtest(simerp[,1:251],design=model.matrix(~y,data=simerp),nbsamples=500)
> plot(frames,sign(tests$signal)*sqrt(tests$r2),type="l",xlab="Time (ms)",
+    ylab="Correlation",ylim=c(-1,1))
> points(frames[tests$significant],rep(-1,length(tests$significant)),
+    pch=16,col="blue")
> title("Simulation")
>
> ### Benjamini-Hochberg Significance testing
>
> tests = erptest(simerp[,1:251],design=model.matrix(~y,data=simerp))
> plot(frames,sign(tests$signal)*sqrt(tests$r2),type="l",xlab="Time (ms)",
+    ylab="Correlation",ylim=c(-1,1))
> points(frames[tests$significant],rep(-1,length(tests$significant)),
+    pch=16,col="blue")
> title("Simulation")
>
> ### AFA significance testing
>
> tests = erpfatest(simerp[,1:251],design=model.matrix(~y,data=simerp),nbf=5,min.err=1e-01,maxiter=10)
> plot(frames,sign(tests$signal)*sqrt(tests$r2),type="l",xlab="Time (ms)",
+    ylab="Correlation",ylim=c(-1,1))
> points(frames[tests$significant],rep(-1,length(tests$significant)),
+    pch=16,col="blue")
> title("Simulation")
>
>
>
>
>
> dev.off()
null device
          1
>
|