R: Significance testing of averaged ERPs. The entire ERP...
erpavetest
R Documentation
Significance testing of averaged ERPs. The entire ERP recording time is first partitioned into a pre-determined number
of equal intervals. The averaged ERPs for each time intervals are the input for analysis.
Description
The function first calculates averaged ERP values within a predetermined number of equally-spaced intervals then tests
for significance of the relationship between averaged ERPs and covariates in a linear model framework.
Data frame containing the ERP curves: each column corresponds to a time frame and each row to a curve.
design
Design matrix of the full model for the relationship between the ERP and the experimental variables.
Typically the output of the function model.matrix
design0
Design matrix of the null model. Typically a submodel of the full model, obtained by removing columns from design.
Default is NULL, corresponding to the model with no covariates.
nintervals
Number of intervals in the partition of the whole interval of observation. Default is 10.
method
FDR- or FWER- controlling multiple testing procedures as available in the function p.adjust. Default is "none".
alpha
The FDR or FWER control level. Default is 0.05
Value
pval
p-values of the tests.
correctedpval
Corrected p-values, for the multiplicity of tests. Depends on the multiple testing method (see function p.adjust).
significant
Indices of the time points for which the test is positive.
segments
Factor giving the membership of timepoints to each interval in the partition.
breaks
Breakpoints of the partition.
test
F-statistics.
df1
Residual degrees of freedom for the full model.
df0
Residual degrees of freedom for the null model.
signal
Estimated signal: a pxT matrix, where p is the difference between the numbers of parameters in the full and null models and T the number of frames.
require(mnormt)
require(fdrtool)
data(erpcz)
data(simerp)
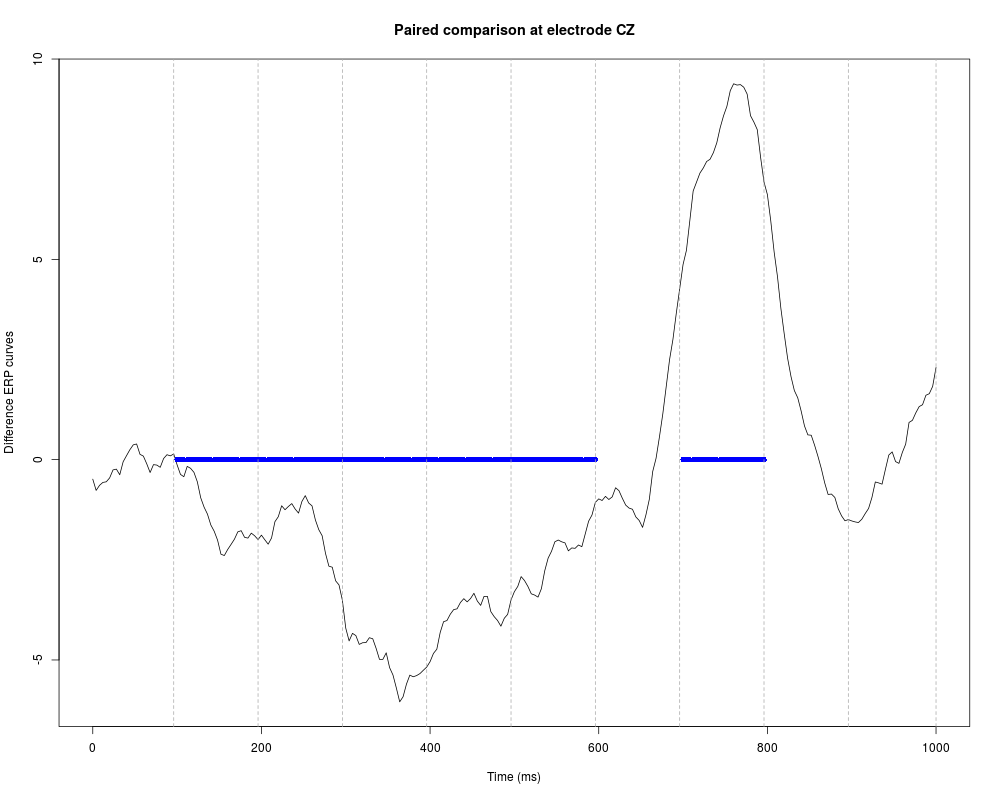
# Paired t-tests for the comparison of ERP curves between two groups
tests = erpavetest(erpcz[,1:251],design=model.matrix(~Subject+Instruction,data=erpcz),
design0=model.matrix(~Subject,data=erpcz))
frames = seq(0,1001,4)
plot(frames,tests$signal,type="l",xlab="Time (ms)",ylab="Difference ERP curves")
points(frames[tests$significant],rep(0,length(tests$significant)),pch=16,col="blue")
abline(v=frames[tests$breaks],lty=2,col="darkgray")
title("Paired comparison at electrode CZ")
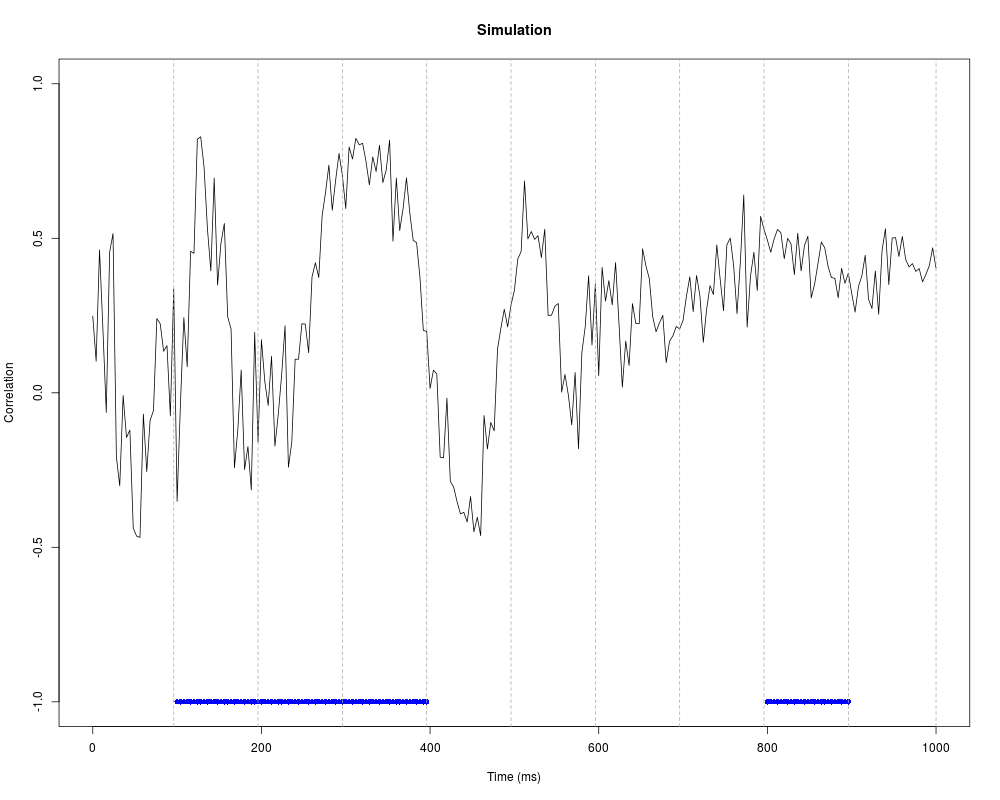
# Tests for significance of correlations
tests = erpavetest(simerp[,1:251],design=model.matrix(~y,data=simerp))
plot(frames,sign(tests$signal)*sqrt(tests$r2),type="l",
xlab="Time (ms)",ylab="Correlation",ylim=c(-1,1))
points(frames[tests$significant],rep(-1,length(tests$significant)),
pch=16,col="blue")
abline(v=frames[tests$breaks],lty=2,col="darkgray")
title("Simulation")
Results
R version 3.3.1 (2016-06-21) -- "Bug in Your Hair"
Copyright (C) 2016 The R Foundation for Statistical Computing
Platform: x86_64-pc-linux-gnu (64-bit)

R is free software and comes with ABSOLUTELY NO WARRANTY.
You are welcome to redistribute it under certain conditions.
Type 'license()' or 'licence()' for distribution details.

R is a collaborative project with many contributors.
Type 'contributors()' for more information and
'citation()' on how to cite R or R packages in publications.

Type 'demo()' for some demos, 'help()' for on-line help, or
'help.start()' for an HTML browser interface to help.
Type 'q()' to quit R.

> library(ERP)
> png(filename="/home/ddbj/snapshot/RGM3/R_CC/result/ERP/erpavetest.Rd_%03d_medium.png", width=480, height=480)
> ### Name: erpavetest
> ### Title: Significance testing of averaged ERPs. The entire ERP recording
> ###   time is first partitioned into a pre-determined number of equal
> ###   intervals. The averaged ERPs for each time intervals are the input
> ###   for analysis.
> ### Aliases: erpavetest
> ### Keywords: ERP data FDR Multiple testing
>
> ### ** Examples
>
>
> require(mnormt)
Loading required package: mnormt
> require(fdrtool)
Loading required package: fdrtool
>
> data(erpcz)
> data(simerp)
>
> # Paired t-tests for the comparison of ERP curves between two groups
>
> tests = erpavetest(erpcz[,1:251],design=model.matrix(~Subject+Instruction,data=erpcz),
+    design0=model.matrix(~Subject,data=erpcz))
>
> frames = seq(0,1001,4)
> plot(frames,tests$signal,type="l",xlab="Time (ms)",ylab="Difference ERP curves")
> points(frames[tests$significant],rep(0,length(tests$significant)),pch=16,col="blue")
> abline(v=frames[tests$breaks],lty=2,col="darkgray")
> title("Paired comparison at electrode CZ")
>
> # Tests for significance of correlations
>
> tests = erpavetest(simerp[,1:251],design=model.matrix(~y,data=simerp))
>
> plot(frames,sign(tests$signal)*sqrt(tests$r2),type="l",
+    xlab="Time (ms)",ylab="Correlation",ylim=c(-1,1))
> points(frames[tests$significant],rep(-1,length(tests$significant)),
+    pch=16,col="blue")
> abline(v=frames[tests$breaks],lty=2,col="darkgray")
> title("Simulation")
>
>
>
>
>
> dev.off()
null device
          1
>
 .
.