Supported by Dr. Osamu Ogasawara and  . . |
|
Last data update: 2014.03.03 |
Adaptive Factor-Adjustement for multiple testing of ERP dataDescriptionAn adaptive factor-adjusted FDR- and FWER-controlling multiple testing procedures for ERP data. The procedure is described in detail in Sheu, Perthame, Lee, and Causeur (2016). Usageerpfatest(dta, design, design0 = NULL, method = "BH", nbf = NULL, nbfmax = 15, alpha = 0.05, pi0 = 1, wantplot = FALSE, s0 = NULL, min.err = 0.001, maxiter = 5, verbose = FALSE) Arguments
DetailsThe method is described in Sheu et al. (2016). It combines a decorrelation step based on a regression factor model as in Leek and Storey (2008), Friguet et al. (2009) or Sun et al. (2012) with an adaptive estimation of the ERP signal. The multiple testing corrections of the p-values are described in the help documentation of the function p.adjust of package stats. Value
Author(s)David Causeur - david.causeur@agrocampus-ouest.fr ReferencesCauseur, D., Chu, M.-C., Hsieh, S., Sheu, C.-F. 2012. A factor-adjusted multiple testing procedure for ERP data analysis. Behavior Research Methods, 44, 635-643. Friguet, C., Kloareg, M., Causeur, D. 2009. A factor model approach to multiple testing under dependence. Journal of the American Statistical Association, 104, 1406-1415. Leek, J.T., Storey, J.D. 2008. A general framework for multiple testing dependence. Proceedings of the National Academy of Sciences of the United States of America, 105, 18718-18723. Sheu, C.-F., Perthame, E., Lee Y.-S. and Causeur, D. 2016. Accounting for time dependence in large-scale multiple testing of event-related potential data. To appear in Annals of Applied Statistics. Storey, J. D., Tibshirani, R. 2003. Statistical significance for genome-wide experiments. Proceedings of the National Academy of Sciences of the United States of America, 100, 9440-9445. Sun, Y., Zhang, N.R., Owen, A.B. 2012. Multiple hypothesis testing adjusted for latent variables, with an application to the AGEMAP gene expression data. The Annals of Applied Statistics, 6, no. 4, 1664-1688. See Also
Examples
require(mnormt)
require(fdrtool)
data(erpcz)
data(simerp)
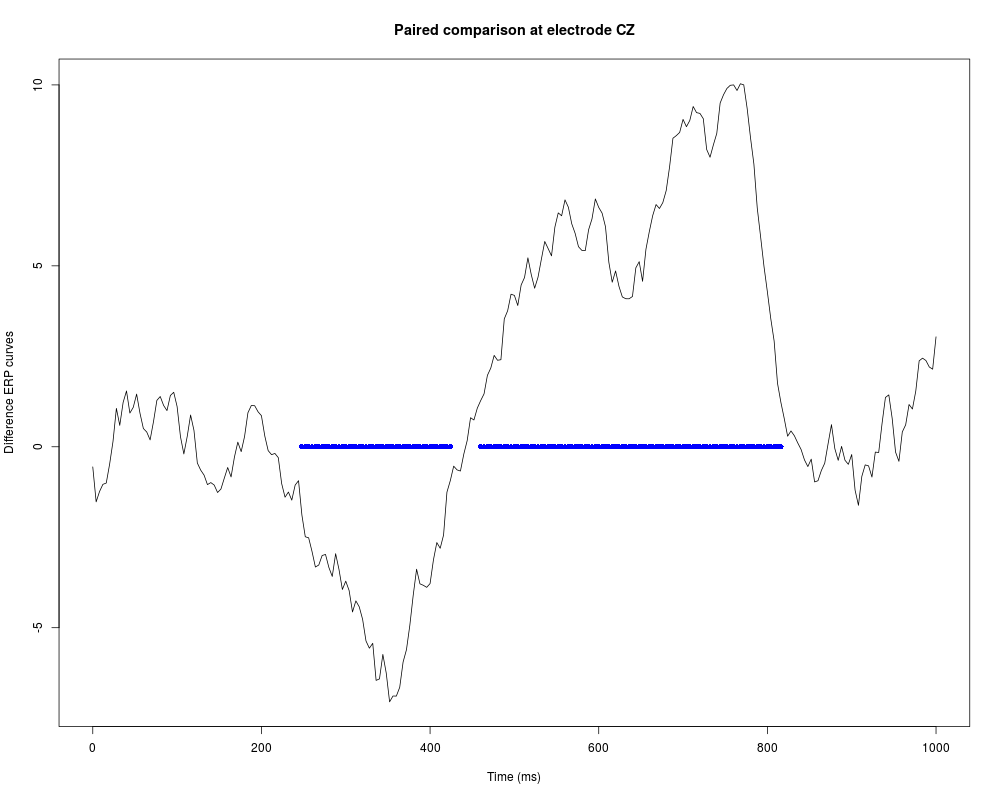
# Paired t-tests for the comparison of ERP curves between two groups
tests = erpfatest(erpcz[,1:251],design=model.matrix(~Subject+Instruction,data=erpcz),
design0=model.matrix(~Subject,data=erpcz),nbf=3,s0=c(1:50,226:251),min.err=1e-01)
frames = seq(0,1001,4)
plot(frames,tests$signal,type="l",xlab="Time (ms)",ylab="Difference ERP curves")
points(frames[tests$significant],rep(0,length(tests$significant)),pch=16,col="blue")
title("Paired comparison at electrode CZ")
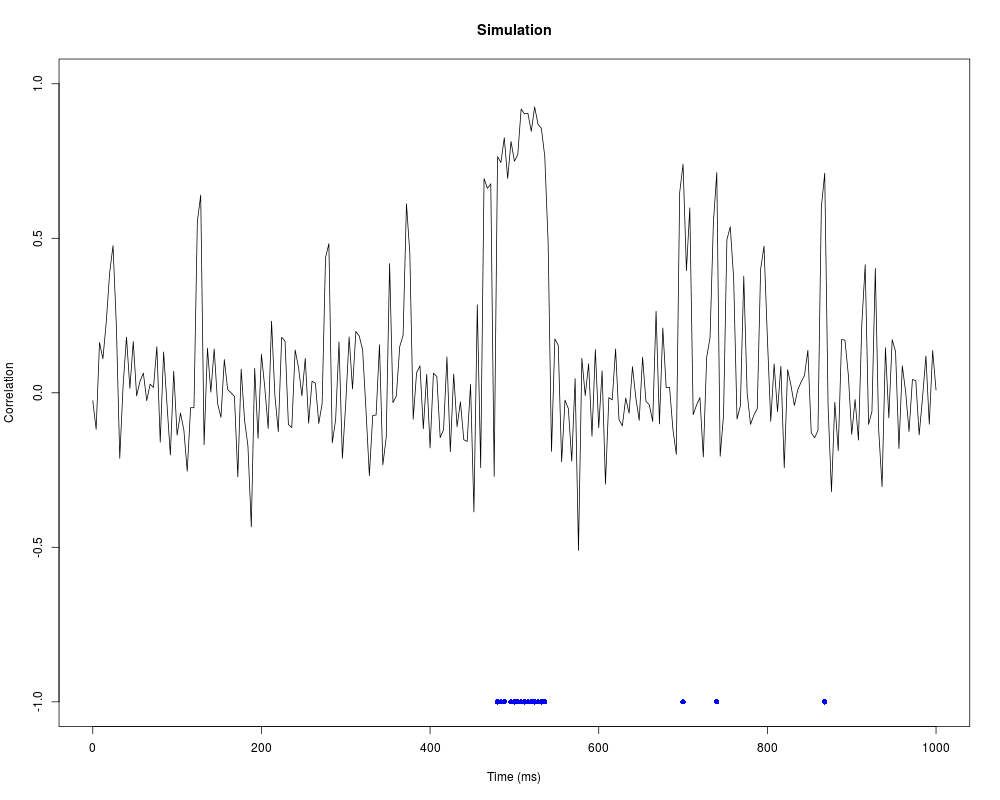
# Tests for significance of correlations
tests = erpfatest(simerp[,1:251],design=model.matrix(~y,data=simerp),
nbf=5,min.err=1e-01,maxiter=10)
plot(frames,sign(tests$signal)*sqrt(tests$r2),type="l",
xlab="Time (ms)",ylab="Correlation",ylim=c(-1,1))
points(frames[tests$significant],rep(-1,length(tests$significant)),
pch=16,col="blue")
title("Simulation")
Results
R version 3.3.1 (2016-06-21) -- "Bug in Your Hair"
Copyright (C) 2016 The R Foundation for Statistical Computing
Platform: x86_64-pc-linux-gnu (64-bit)

R is free software and comes with ABSOLUTELY NO WARRANTY.
You are welcome to redistribute it under certain conditions.
Type 'license()' or 'licence()' for distribution details.

R is a collaborative project with many contributors.
Type 'contributors()' for more information and
'citation()' on how to cite R or R packages in publications.

Type 'demo()' for some demos, 'help()' for on-line help, or
'help.start()' for an HTML browser interface to help.
Type 'q()' to quit R.

> library(ERP)
> png(filename="/home/ddbj/snapshot/RGM3/R_CC/result/ERP/erpfatest.Rd_%03d_medium.png", width=480, height=480)
> ### Name: erpfatest
> ### Title: Adaptive Factor-Adjustement for multiple testing of ERP data
> ### Aliases: erpfatest
> ### Keywords: ERP data FDR Factor-adjustment Multiple testing
>
> ### ** Examples
>
> require(mnormt)
Loading required package: mnormt
> require(fdrtool)
Loading required package: fdrtool
>
> data(erpcz)
> data(simerp)
>
> # Paired t-tests for the comparison of ERP curves between two groups
>
> tests = erpfatest(erpcz[,1:251],design=model.matrix(~Subject+Instruction,data=erpcz),
+    design0=model.matrix(~Subject,data=erpcz),nbf=3,s0=c(1:50,226:251),min.err=1e-01)
>
> frames = seq(0,1001,4)
> plot(frames,tests$signal,type="l",xlab="Time (ms)",ylab="Difference ERP curves")
> points(frames[tests$significant],rep(0,length(tests$significant)),pch=16,col="blue")
> title("Paired comparison at electrode CZ")
>
> # Tests for significance of correlations
>
> tests = erpfatest(simerp[,1:251],design=model.matrix(~y,data=simerp),
+    nbf=5,min.err=1e-01,maxiter=10)
> plot(frames,sign(tests$signal)*sqrt(tests$r2),type="l",
+    xlab="Time (ms)",ylab="Correlation",ylim=c(-1,1))
> points(frames[tests$significant],rep(-1,length(tests$significant)),
+    pch=16,col="blue")
> title("Simulation")
>
>
>
>
>
>
> dev.off()
null device
          1
>
|