Supported by Dr. Osamu Ogasawara and  . . |
|
Last data update: 2014.03.03 |
The Guthrie-Buchwald procedure for significance analysis of ERP dataDescriptionMonte-Carlo implementation of the Guthrie-Buchwald procedure (see Guthrie and Buchwald, 1991) which accounts for the auto-correlation among test statistics to control erroneous detections of short intervals. Usagegbtest(dta, design, design0 = NULL, graphthresh = 0.05, nbsamples = 1000) Arguments
DetailsThe Guthrie-Buchwald method starts from a preliminary estimation of r, the lag-1 autocorrelation, among test statistics. Then, the null distribution of the lengths of the intervals $I_alpha = t : pvalue_t <= alpha $, where alpha is the so-called graphical threshold parameter of the method, is obtained using simulations of p-values $p_t$ associated to auto-regressive t-test process of order 1 with mean 0 and auto-correlation r. Such an interval $I_alpha$ is declared significant if its length exceeds the $(1-alpha)-$quantile of the null distribution. Note that the former method is designed to control erroneous detections of short significant intervals but not to control any type-I error rate. Value
Author(s)David Causeur - david.causeur@agrocampus-ouest.fr and Mei-Chen Chu (National Cheng-Kung University, Tainan, Taiwan) ReferencesGuthrie, D. and Buchwald, J.S. (1991). Significance testing of difference potentials. Psychophysiology, 28, 240-244. Sheu, C.-F., Perthame, E., Lee Y.-S. and Causeur, D. (2016). Accounting for time dependence in large-scale multiple testing of event-related potentials data. To appear in Annals of Applied Statistics. See Also
Examples
require(mnormt)
data(erpcz)
data(simerp)
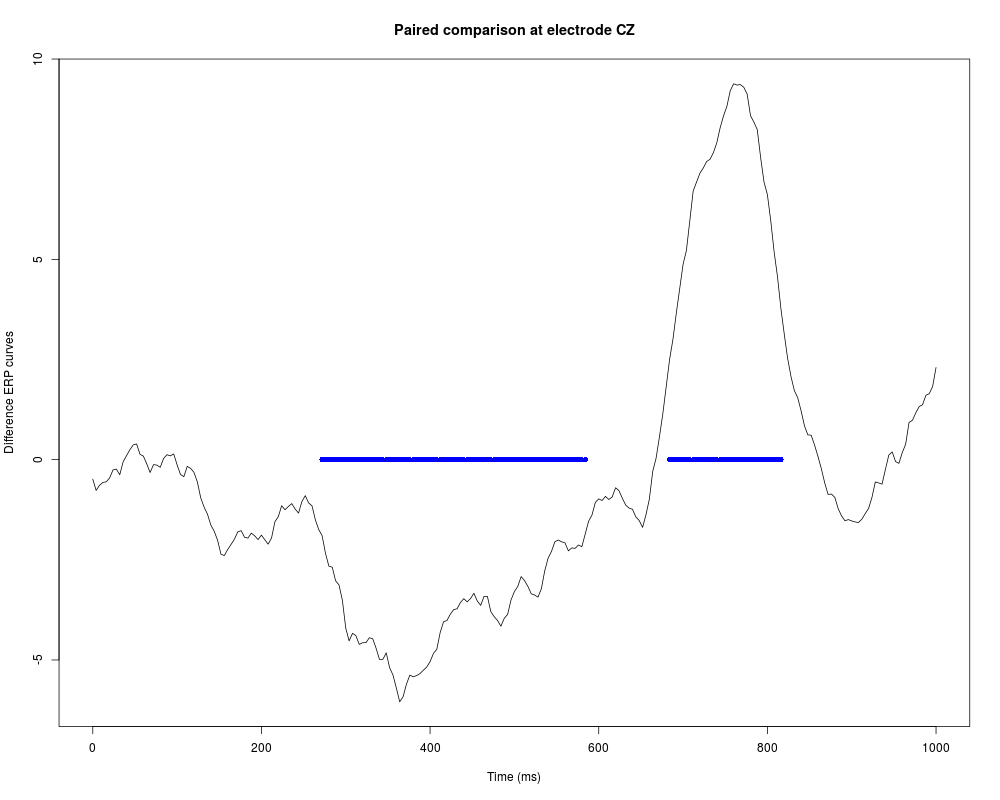
# Paired comparison of ERP curves
tests = gbtest(erpcz[,1:251],design=model.matrix(~Subject+Instruction,data=erpcz),
design0=model.matrix(~Subject,data=erpcz),nbsamples=500)
frames = seq(0,1001,4)
plot(frames,tests$signal,type="l",xlab="Time (ms)",
ylab="Difference ERP curves")
points(frames[tests$significant],rep(0,length(tests$significant)),
pch=16,col="blue")
title("Paired comparison at electrode CZ")
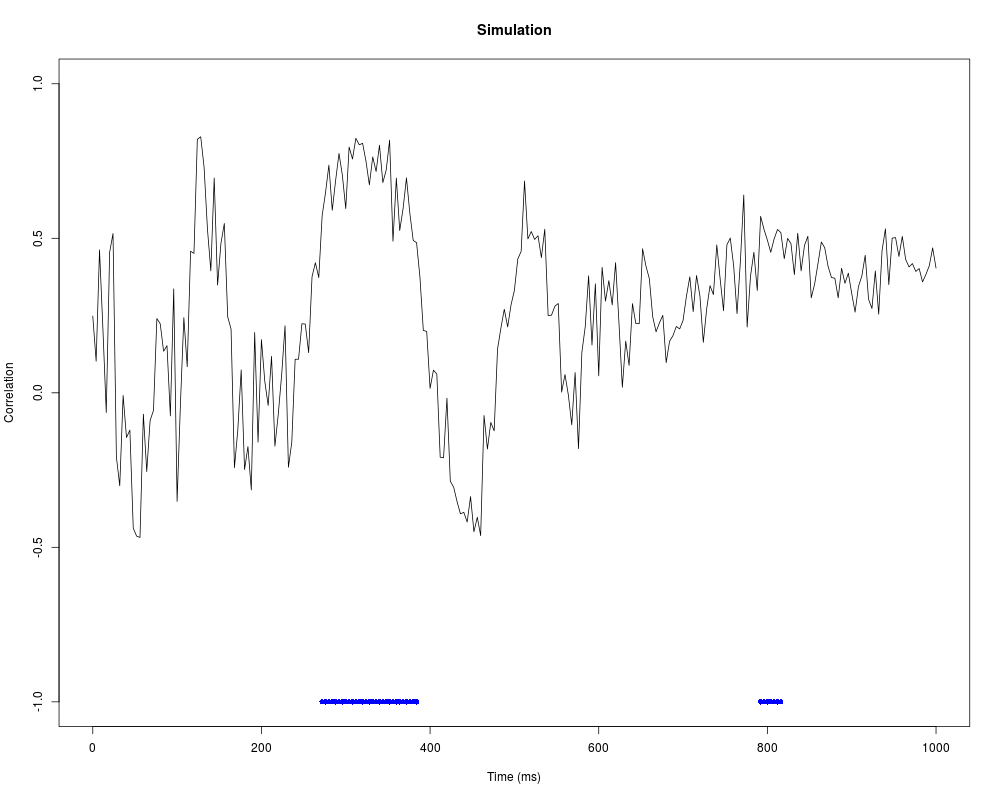
# Tests for significance of correlations
tests = gbtest(simerp[,1:251],design=model.matrix(~y,data=simerp),nbsamples=500)
plot(frames,sign(tests$signal)*sqrt(tests$r2),type="l",xlab="Time (ms)",
ylab="Correlation",ylim=c(-1,1))
points(frames[tests$significant],rep(-1,length(tests$significant)),
pch=16,col="blue")
title("Simulation")
Results
R version 3.3.1 (2016-06-21) -- "Bug in Your Hair"
Copyright (C) 2016 The R Foundation for Statistical Computing
Platform: x86_64-pc-linux-gnu (64-bit)

R is free software and comes with ABSOLUTELY NO WARRANTY.
You are welcome to redistribute it under certain conditions.
Type 'license()' or 'licence()' for distribution details.

R is a collaborative project with many contributors.
Type 'contributors()' for more information and
'citation()' on how to cite R or R packages in publications.

Type 'demo()' for some demos, 'help()' for on-line help, or
'help.start()' for an HTML browser interface to help.
Type 'q()' to quit R.

> library(ERP)
> png(filename="/home/ddbj/snapshot/RGM3/R_CC/result/ERP/gbtest.Rd_%03d_medium.png", width=480, height=480)
> ### Name: gbtest
> ### Title: The Guthrie-Buchwald procedure for significance analysis of ERP
> ###   data
> ### Aliases: gbtest
> ### Keywords: ERP Guthrie-Buchwald procedure Multiple testing
>
> ### ** Examples
>
> require(mnormt)
Loading required package: mnormt
> data(erpcz)
> data(simerp)
>
> # Paired comparison of ERP curves
>
> tests = gbtest(erpcz[,1:251],design=model.matrix(~Subject+Instruction,data=erpcz),
+    design0=model.matrix(~Subject,data=erpcz),nbsamples=500)
>
> frames = seq(0,1001,4)
> plot(frames,tests$signal,type="l",xlab="Time (ms)",
+   ylab="Difference ERP curves")
> points(frames[tests$significant],rep(0,length(tests$significant)),
+    pch=16,col="blue")
> title("Paired comparison at electrode CZ")
>
> # Tests for significance of correlations
>
> tests = gbtest(simerp[,1:251],design=model.matrix(~y,data=simerp),nbsamples=500)
> plot(frames,sign(tests$signal)*sqrt(tests$r2),type="l",xlab="Time (ms)",
+    ylab="Correlation",ylim=c(-1,1))
> points(frames[tests$significant],rep(-1,length(tests$significant)),
+    pch=16,col="blue")
> title("Simulation")
>
>
>
>
>
> dev.off()
null device
          1
>
|