Supported by Dr. Osamu Ogasawara and  . . |
|
Last data update: 2014.03.03 |
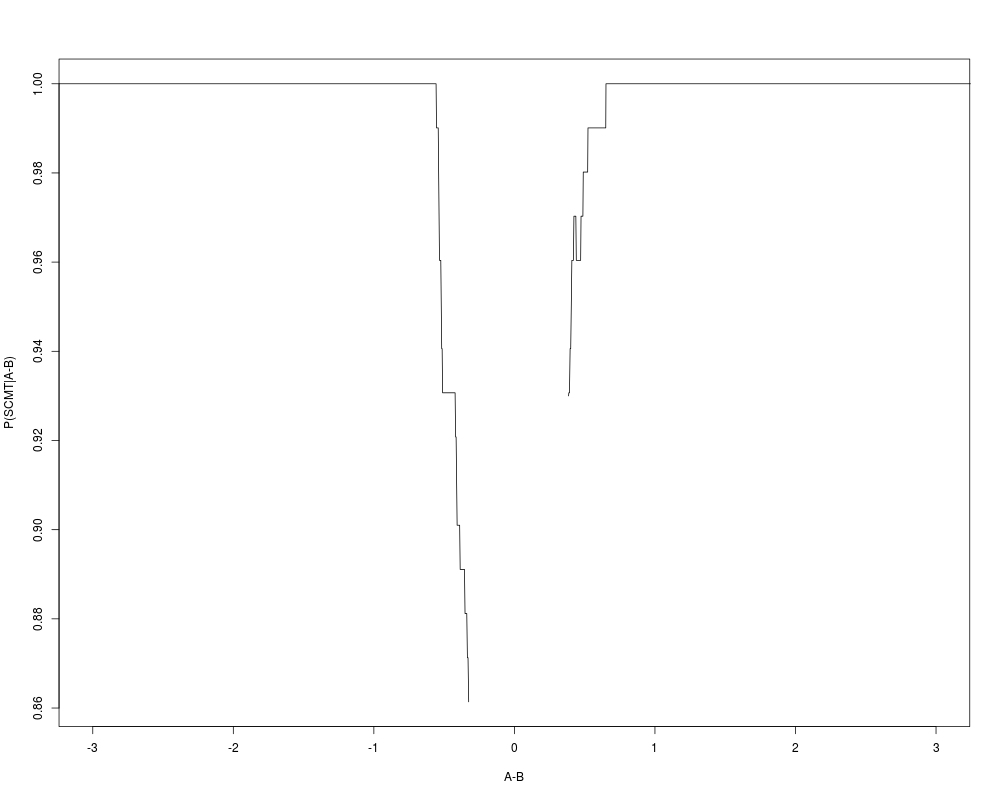
Produce a plot similar to Figure 2 of the Shippy MAQC paper (PMID 16964226).DescriptionProduce a plot similar to Figure 2 of the Shippy MAQC paper (PMID 16964226). Usageproboscis(es, site=1, ABp=0.001, CDp=0.01, mmrad=100) Arguments
DetailsFigure 2 of the Shippy paper consists of a collection of plots of estimated probabilities of self-consistent monotone titration – briefly, samples are such that A has 100% USRNA, B has 100% Ambion brain, C has 75% USRNA+25% brain, D has 25% USRNA, 75% brain. Self-consistent monotone titration holds for gene g if microarray measures for that gene satisfy A > C > D > B or B > C > D > A. The estimated probability functions look like a creature sticking its nose over a wall, thus the name of this function. Valuean instance of Author(s)Vince Carey <stvjc@channing.harvard.edu> ReferencesPMID 16964226 Examplesdata(afxsubRMAES) NN2 = proboscis(afxsubRMAES, site=2) plot(NN2) Results
R version 3.3.1 (2016-06-21) -- "Bug in Your Hair"
Copyright (C) 2016 The R Foundation for Statistical Computing
Platform: x86_64-pc-linux-gnu (64-bit)

R is free software and comes with ABSOLUTELY NO WARRANTY.
You are welcome to redistribute it under certain conditions.
Type 'license()' or 'licence()' for distribution details.

R is a collaborative project with many contributors.
Type 'contributors()' for more information and
'citation()' on how to cite R or R packages in publications.

Type 'demo()' for some demos, 'help()' for on-line help, or
'help.start()' for an HTML browser interface to help.
Type 'q()' to quit R.

> library(MAQCsubset)
Loading required package: affy
Loading required package: BiocGenerics
Loading required package: parallel

Attaching package: 'BiocGenerics'

The following objects are masked from 'package:parallel':

    clusterApply, clusterApplyLB, clusterCall, clusterEvalQ,
    clusterExport, clusterMap, parApply, parCapply, parLapply,
    parLapplyLB, parRapply, parSapply, parSapplyLB

The following objects are masked from 'package:stats':

    IQR, mad, xtabs

The following objects are masked from 'package:base':

    Filter, Find, Map, Position, Reduce, anyDuplicated, append,
    as.data.frame, cbind, colnames, do.call, duplicated, eval, evalq,
    get, grep, grepl, intersect, is.unsorted, lapply, lengths, mapply,
    match, mget, order, paste, pmax, pmax.int, pmin, pmin.int, rank,
    rbind, rownames, sapply, setdiff, sort, table, tapply, union,
    unique, unsplit

Loading required package: Biobase
Welcome to Bioconductor

    Vignettes contain introductory material; view with
    'browseVignettes()'. To cite Bioconductor, see
    'citation("Biobase")', and for packages 'citation("pkgname")'.

Loading required package: lumi
Setting options('download.file.method.GEOquery'='auto')
Setting options('GEOquery.inmemory.gpl'=FALSE)

Attaching package: 'lumi'

The following objects are masked from 'package:affy':

    MAplot, plotDensity

> png(filename="/home/ddbj/snapshot/RGM3/R_BC/result/MAQCsubset/proboscis.Rd_%03d_medium.png", width=480, height=480)
> ### Name: proboscis
> ### Title: Produce a plot similar to Figure 2 of the Shippy MAQC paper
> ###   (PMID 16964226).
> ### Aliases: proboscis
> ### Keywords: models
>
> ### ** Examples
>
> data(afxsubRMAES)
> NN2 = proboscis(afxsubRMAES, site=2)
Loading required package: genefilter
> plot(NN2)
>
>
>
>
>
> dev.off()
null device
          1
>
|