Supported by Dr. Osamu Ogasawara and  . . |
|
Last data update: 2014.03.03 |
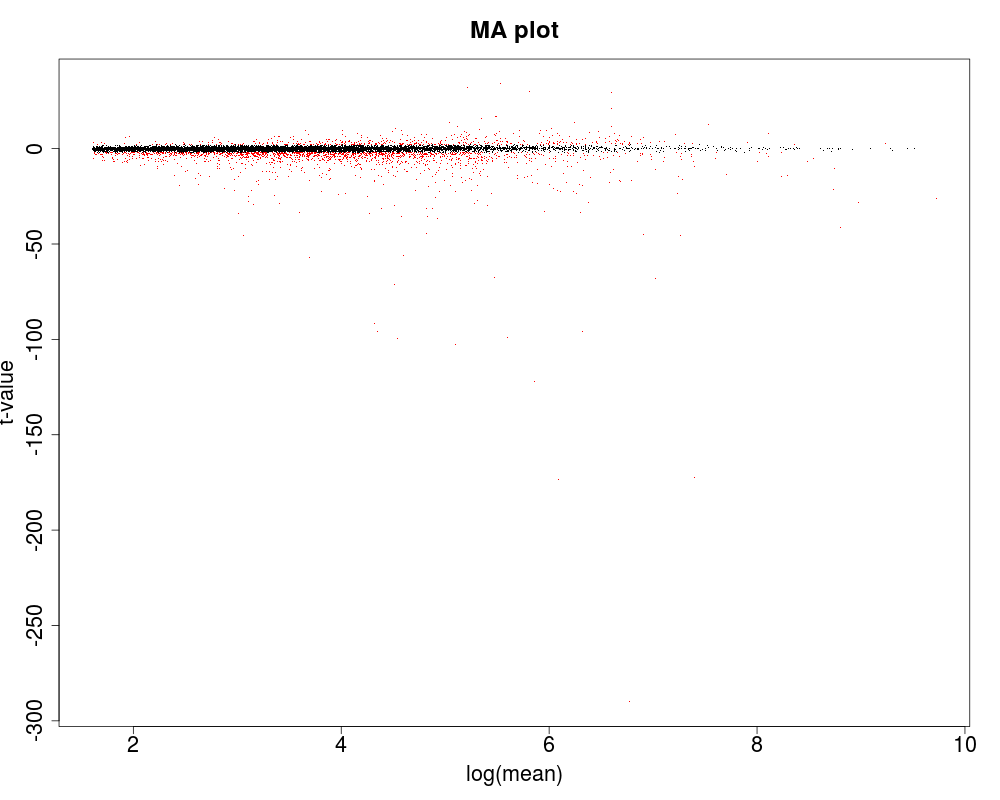
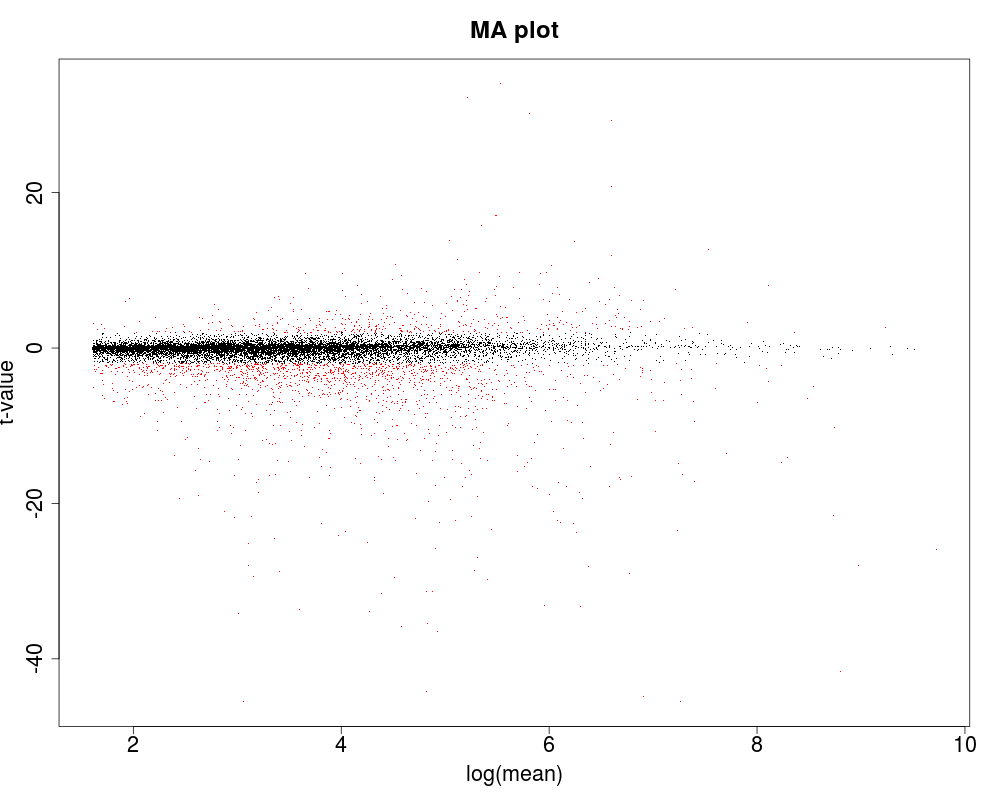
MA plot of t-values Against Log MeanDescriptionThis function is to display MA plot of t-value against log mean. Usagemaplot(dat, r1, r2, TT, matitle) Arguments
DetailsIn MA plot, t-value is in y-axis and log mean in x-axis; Black points gathered nearby zero along log mean are genes without differential expressions or differential splicings while red points scattered out of black points are those of being differentially expressed or differentially spliced. Valueno return value Author(s)Yuan-De Tan tanyuande@gmail.com Examplesdata(dat) maplot(dat=dat,r1=3,r2=3,TT=350,matitle="MA plot") maplot(dat=dat,r1=3,r2=3,TT=50,matitle="MA plot") Results
R version 3.3.1 (2016-06-21) -- "Bug in Your Hair"
Copyright (C) 2016 The R Foundation for Statistical Computing
Platform: x86_64-pc-linux-gnu (64-bit)

R is free software and comes with ABSOLUTELY NO WARRANTY.
You are welcome to redistribute it under certain conditions.
Type 'license()' or 'licence()' for distribution details.

R is a collaborative project with many contributors.
Type 'contributors()' for more information and
'citation()' on how to cite R or R packages in publications.

Type 'demo()' for some demos, 'help()' for on-line help, or
'help.start()' for an HTML browser interface to help.
Type 'q()' to quit R.

> library(MBttest)
Loading required package: gplots

Attaching package: 'gplots'

The following object is masked from 'package:stats':

    lowess

Loading required package: gtools
> png(filename="/home/ddbj/snapshot/RGM3/R_BC/result/MBttest/maplot.Rd_%03d_medium.png", width=480, height=480)
> ### Name: maplot
> ### Title: MA plot of t-values Against Log Mean
> ### Aliases: maplot
> ### Keywords: maplot
>
> ### ** Examples
>
> data(dat)
> maplot(dat=dat,r1=3,r2=3,TT=350,matitle="MA plot")
> maplot(dat=dat,r1=3,r2=3,TT=50,matitle="MA plot")
>
>
>
>
>
>
> dev.off()
null device
          1
>
|
Created & Maintained by Osamu Ogasawara (osamu.ogasawara@gmail.com) and 