Supported by Dr. Osamu Ogasawara and  . . |
|
Last data update: 2014.03.03 |
HeatmapDescriptionThis function is used to display heatmap of differential expressions of genes or isoforms or differential splicings of genes detected by the multiple beta t-test method in the real data. Usagemyheatmap(dat, r1, r2, W, colrs, tree, method, rwangle, clangle, maptitle) Arguments
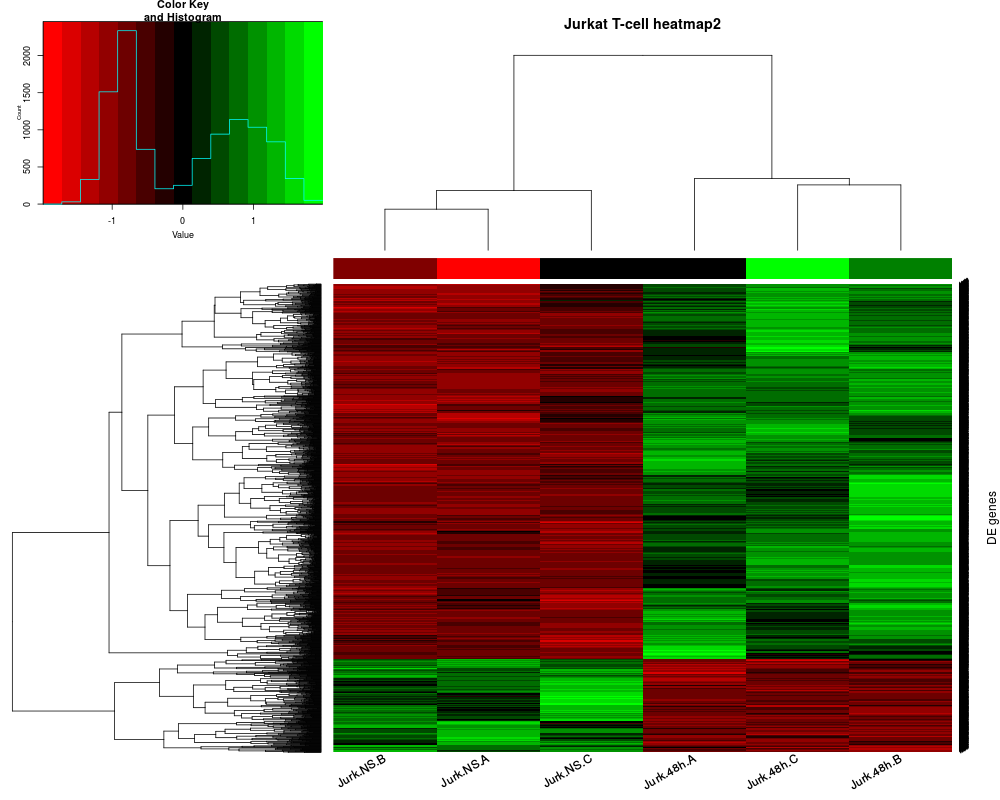
DetailsThis function uses W (omega) and symb to choose genes or isoforms in the data ordered by t-values and then to normalize the selected data by using z-scale. This function has multiple options to select map color, distance, cluster and x- and y-lab angles. The heatmap was designed for publication and presentation, that is, zoom of the figure can be reduced without impacting solution. Valueno return value but create a heatmap. Notemyheatmap requres gplots Author(s)Yuan-De Tan tanyuande@gmail.com See Also
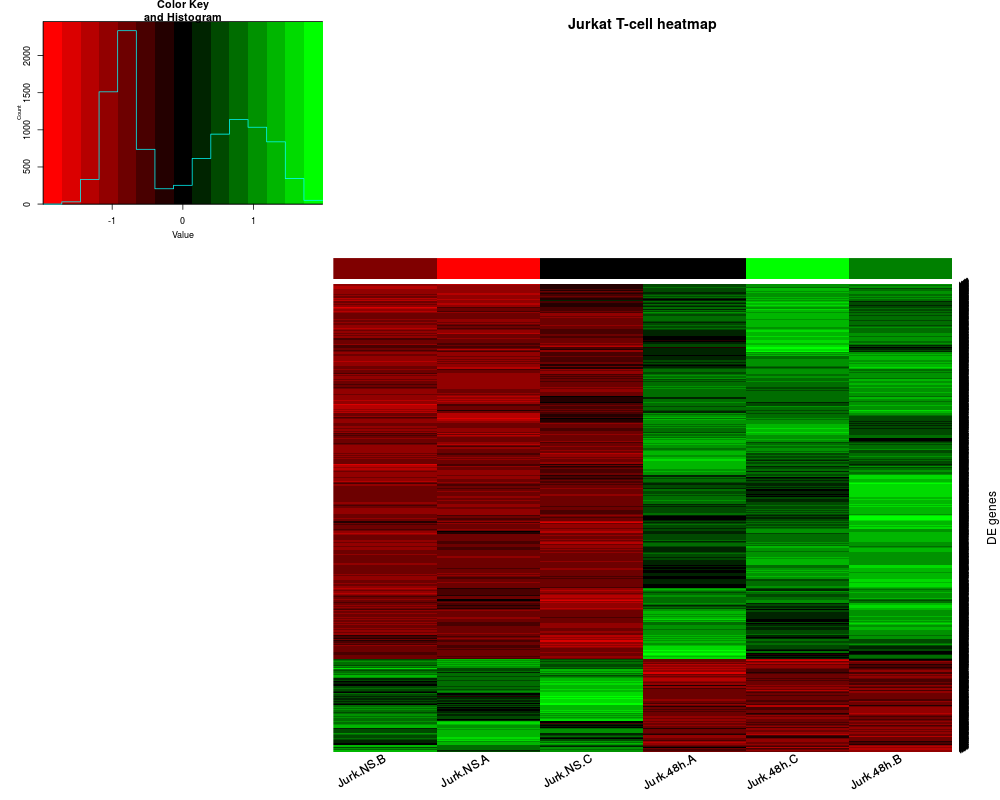
Examplesrequire(gplots) data(dat) #dat<-mbetattest(X=jkttcell,na=3,nb=3,W=1,alpha=0.05, #file="C:/mBeta_ttest/R_package/jurkat_NS_48h_tag_mbetattest.csv") # data(mtcars) #x <-as.matrix(mtcars) #myheatmap(dat=x,r1=3,r2=3, maptitle="mtcars_heatmap") myheatmap(dat=dat,r1=3,r2=3,maptitle="Jurkat T-cell heatmap2") myheatmap(dat=dat,r1=3,r2=3,tree="none",maptitle="Jurkat T-cell heatmap") Results
R version 3.3.1 (2016-06-21) -- "Bug in Your Hair"
Copyright (C) 2016 The R Foundation for Statistical Computing
Platform: x86_64-pc-linux-gnu (64-bit)

R is free software and comes with ABSOLUTELY NO WARRANTY.
You are welcome to redistribute it under certain conditions.
Type 'license()' or 'licence()' for distribution details.

R is a collaborative project with many contributors.
Type 'contributors()' for more information and
'citation()' on how to cite R or R packages in publications.

Type 'demo()' for some demos, 'help()' for on-line help, or
'help.start()' for an HTML browser interface to help.
Type 'q()' to quit R.

> library(MBttest)
Loading required package: gplots

Attaching package: 'gplots'

The following object is masked from 'package:stats':

    lowess

Loading required package: gtools
> png(filename="/home/ddbj/snapshot/RGM3/R_BC/result/MBttest/myheatmap.Rd_%03d_medium.png", width=480, height=480)
> ### Name: myheatmap
> ### Title: Heatmap
> ### Aliases: myheatmap
> ### Keywords: heatmap
>
> ### ** Examples
>
> require(gplots)
> data(dat)
>
> #dat<-mbetattest(X=jkttcell,na=3,nb=3,W=1,alpha=0.05,
> #file="C:/mBeta_ttest/R_package/jurkat_NS_48h_tag_mbetattest.csv")
>
> # data(mtcars)
> #x  <-as.matrix(mtcars)
> #myheatmap(dat=x,r1=3,r2=3, maptitle="mtcars_heatmap")
>
> myheatmap(dat=dat,r1=3,r2=3,maptitle="Jurkat T-cell heatmap2")
>
> myheatmap(dat=dat,r1=3,r2=3,tree="none",maptitle="Jurkat T-cell heatmap")
>
>
>
>
>
>
> dev.off()
null device
          1
>
|