AnalysisResults, AnalysisRegionResults, ExpressionSet or
MethylationSet
feat
Numeric with the index of the feature or character with its name.
variables
Character vector with the names of the variables to be used
in the splitting. Two variables is the maximum allowed. Note: default values
are only valid for MethylationResults objects.
Value
A plot is generated on the current graphics device.
Examples
if (require(minfiData)){
 set <- prepareMethylationSet(getBeta(MsetEx)[1:1000, ],
 pheno = pData(MsetEx))
 plotFeature(set, 1, variables = "Sample_Group")
 }
Results
R version 3.3.1 (2016-06-21) -- "Bug in Your Hair"
Copyright (C) 2016 The R Foundation for Statistical Computing
Platform: x86_64-pc-linux-gnu (64-bit)
R is free software and comes with ABSOLUTELY NO WARRANTY.
You are welcome to redistribute it under certain conditions.
Type 'license()' or 'licence()' for distribution details.
R is a collaborative project with many contributors.
Type 'contributors()' for more information and
'citation()' on how to cite R or R packages in publications.
Type 'demo()' for some demos, 'help()' for on-line help, or
'help.start()' for an HTML browser interface to help.
Type 'q()' to quit R.
> library(MEAL)
Loading required package: Biobase
Loading required package: BiocGenerics
Loading required package: parallel
Attaching package: 'BiocGenerics'
The following objects are masked from 'package:parallel':
clusterApply, clusterApplyLB, clusterCall, clusterEvalQ,
clusterExport, clusterMap, parApply, parCapply, parLapply,
parLapplyLB, parRapply, parSapply, parSapplyLB
The following objects are masked from 'package:stats':
IQR, mad, xtabs
The following objects are masked from 'package:base':
Filter, Find, Map, Position, Reduce, anyDuplicated, append,
as.data.frame, cbind, colnames, do.call, duplicated, eval, evalq,
get, grep, grepl, intersect, is.unsorted, lapply, lengths, mapply,
match, mget, order, paste, pmax, pmax.int, pmin, pmin.int, rank,
rbind, rownames, sapply, setdiff, sort, table, tapply, union,
unique, unsplit
Welcome to Bioconductor
Vignettes contain introductory material; view with
'browseVignettes()'. To cite Bioconductor, see
'citation("Biobase")', and for packages 'citation("pkgname")'.
Loading required package: MultiDataSet
Setting options('download.file.method.GEOquery'='auto')
Setting options('GEOquery.inmemory.gpl'=FALSE)
> png(filename="/home/ddbj/snapshot/RGM3/R_BC/result/MEAL/plotFeature.Rd_%03d_medium.png", width=480, height=480)
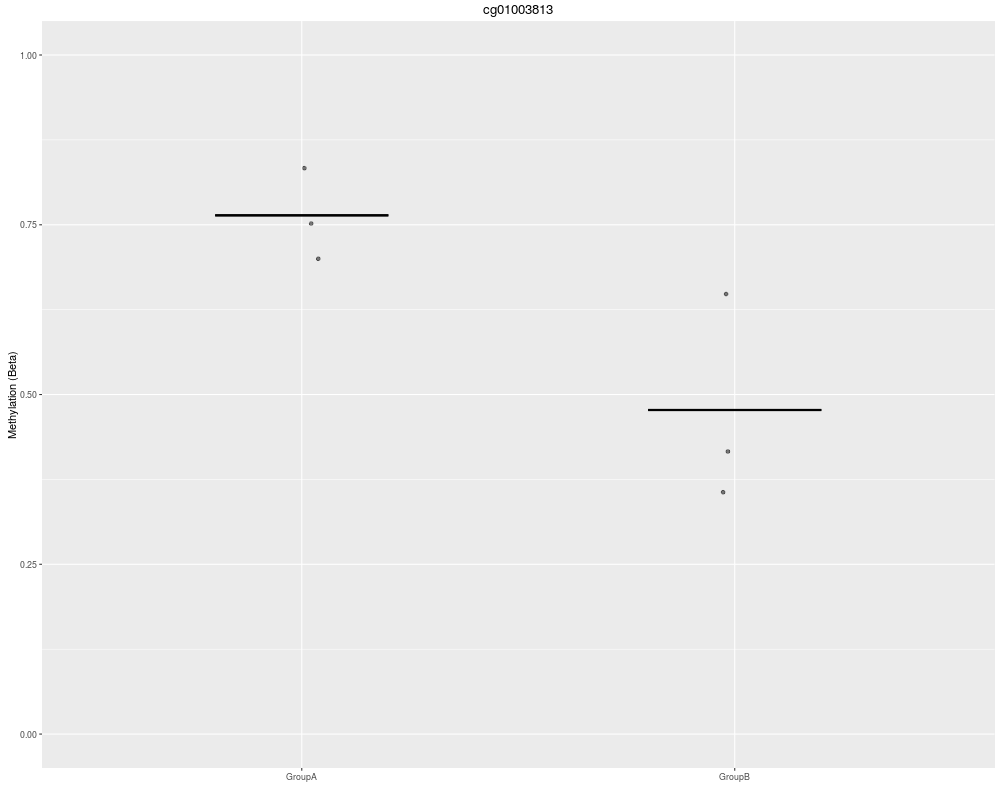
> ### Name: plotFeature
> ### Title: Plot values of a feature
> ### Aliases: plotFeature
>
> ### ** Examples
>
> if (require(minfiData)){
+ set <- prepareMethylationSet(getBeta(MsetEx)[1:1000, ],
+ pheno = pData(MsetEx))
+ plotFeature(set, 1, variables = "Sample_Group")
+ }
Loading required package: minfiData
Loading required package: minfi
Loading required package: lattice
Loading required package: GenomicRanges
Loading required package: S4Vectors
Loading required package: stats4
Attaching package: 'S4Vectors'
The following objects are masked from 'package:base':
colMeans, colSums, expand.grid, rowMeans, rowSums
Loading required package: IRanges
Loading required package: GenomeInfoDb
Loading required package: SummarizedExperiment
Loading required package: Biostrings
Loading required package: XVector
Loading required package: bumphunter
Loading required package: foreach
Loading required package: iterators
Loading required package: locfit
locfit 1.5-9.1 2013-03-22
Loading required package: IlluminaHumanMethylation450kmanifest
Loading required package: IlluminaHumanMethylation450kanno.ilmn12.hg19
>
>
>
>
>
> dev.off()
null device
1
>
 .
.