R version 3.3.1 (2016-06-21) -- "Bug in Your Hair"
Copyright (C) 2016 The R Foundation for Statistical Computing
Platform: x86_64-pc-linux-gnu (64-bit)
R is free software and comes with ABSOLUTELY NO WARRANTY.
You are welcome to redistribute it under certain conditions.
Type 'license()' or 'licence()' for distribution details.
R is a collaborative project with many contributors.
Type 'contributors()' for more information and
'citation()' on how to cite R or R packages in publications.
Type 'demo()' for some demos, 'help()' for on-line help, or
'help.start()' for an HTML browser interface to help.
Type 'q()' to quit R.
> library(MEAL)
Loading required package: Biobase
Loading required package: BiocGenerics
Loading required package: parallel
Attaching package: 'BiocGenerics'
The following objects are masked from 'package:parallel':
clusterApply, clusterApplyLB, clusterCall, clusterEvalQ,
clusterExport, clusterMap, parApply, parCapply, parLapply,
parLapplyLB, parRapply, parSapply, parSapplyLB
The following objects are masked from 'package:stats':
IQR, mad, xtabs
The following objects are masked from 'package:base':
Filter, Find, Map, Position, Reduce, anyDuplicated, append,
as.data.frame, cbind, colnames, do.call, duplicated, eval, evalq,
get, grep, grepl, intersect, is.unsorted, lapply, lengths, mapply,
match, mget, order, paste, pmax, pmax.int, pmin, pmin.int, rank,
rbind, rownames, sapply, setdiff, sort, table, tapply, union,
unique, unsplit
Welcome to Bioconductor
Vignettes contain introductory material; view with
'browseVignettes()'. To cite Bioconductor, see
'citation("Biobase")', and for packages 'citation("pkgname")'.
Loading required package: MultiDataSet
Setting options('download.file.method.GEOquery'='auto')
Setting options('GEOquery.inmemory.gpl'=FALSE)
> png(filename="/home/ddbj/snapshot/RGM3/R_BC/result/MEAL/plotLM.Rd_%03d_medium.png", width=480, height=480)
> ### Name: plotLM
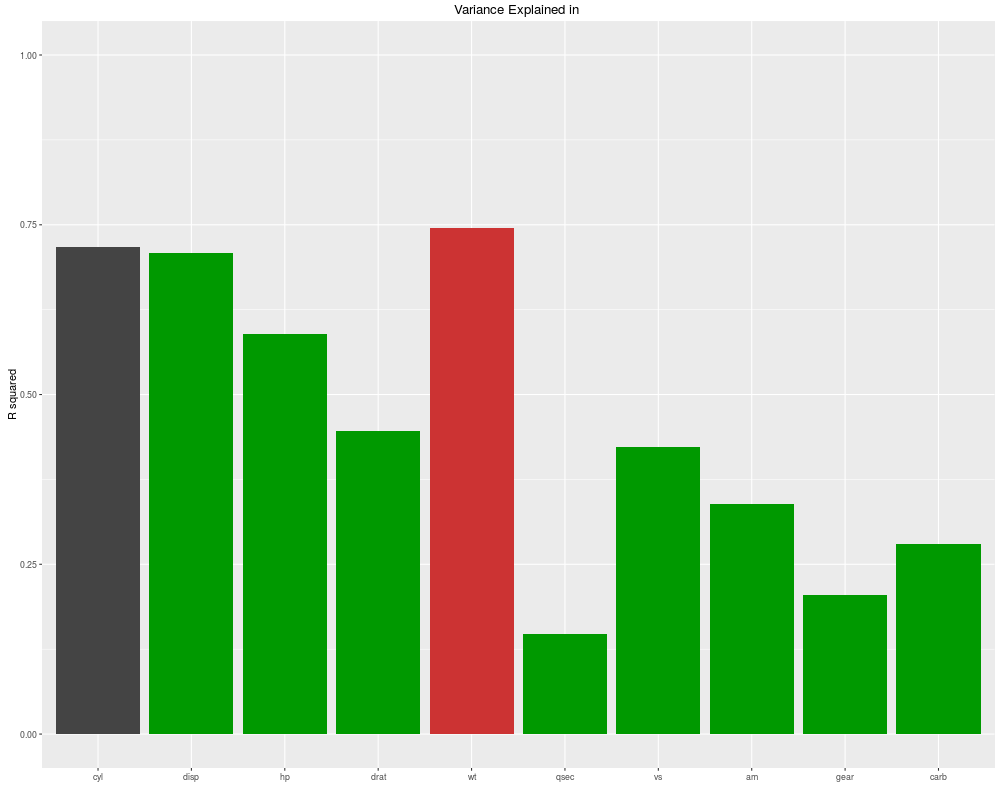
> ### Title: Plot a vector of R2
> ### Aliases: plotLM
>
> ### ** Examples
>
> data(mtcars)
> R2 <- explainedVariance(mtcars, variable_label = "cyl") ## variable equals to cyl column
> plotLM(R2)
>
>
>
>
>
> dev.off()
null device
1
>
 .
.