Supported by Dr. Osamu Ogasawara and  . . |
|
Last data update: 2014.03.03 |
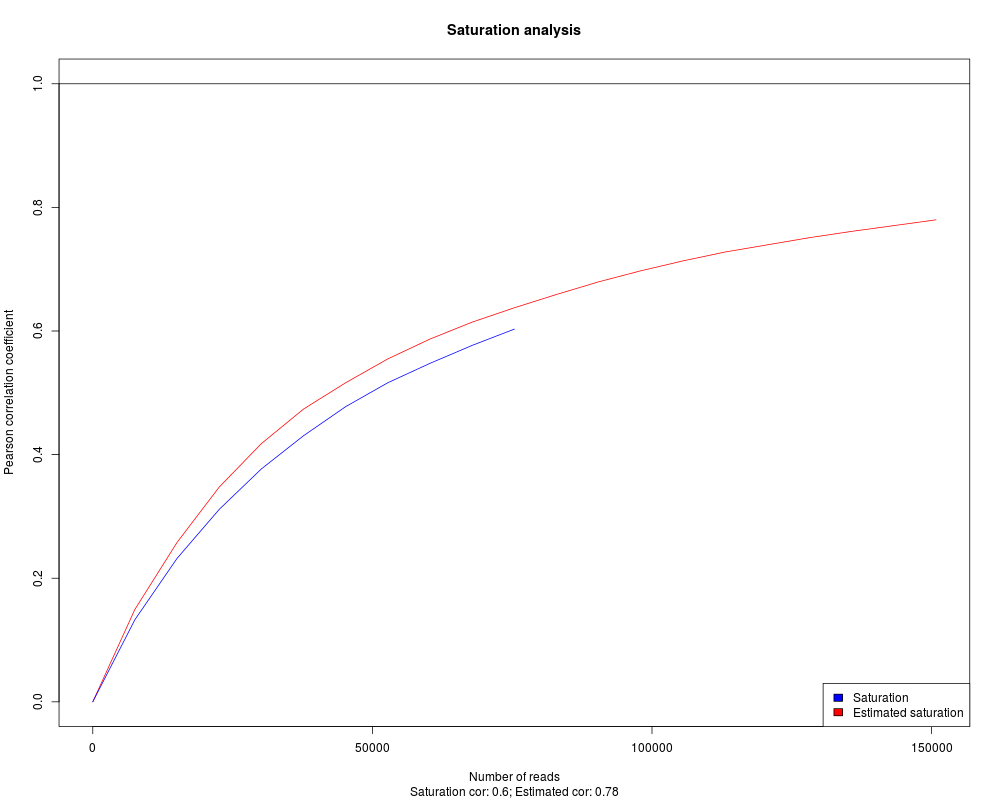
Function plots the results of the MEDIPS.saturationAnalysis function.DescriptionThe results of the saturation analysis will be visualized by the function. UsageMEDIPS.plotSaturation(saturationObj = NULL, main="Saturation analysis") Arguments
ValueThe coverage plot will be visualized. Author(s)Lukas Chavez Examples
library(MEDIPSData)
library(BSgenome.Hsapiens.UCSC.hg19)
bam.file.hESCs.Rep1.MeDIP = system.file("extdata", "hESCs.MeDIP.Rep1.chr22.bam", package="MEDIPSData")

sr=MEDIPS.saturation(file=bam.file.hESCs.Rep1.MeDIP, BSgenome="BSgenome.Hsapiens.UCSC.hg19", uniq=1e-3, extend=250, shift=0, window_size=100, chr.select="chr22", nit=10, nrit=1, empty_bins=TRUE, rank=FALSE)
MEDIPS.plotSaturation(saturationObj = sr, main="Saturation analysis")
Results
R version 3.3.1 (2016-06-21) -- "Bug in Your Hair"
Copyright (C) 2016 The R Foundation for Statistical Computing
Platform: x86_64-pc-linux-gnu (64-bit)

R is free software and comes with ABSOLUTELY NO WARRANTY.
You are welcome to redistribute it under certain conditions.
Type 'license()' or 'licence()' for distribution details.

R is a collaborative project with many contributors.
Type 'contributors()' for more information and
'citation()' on how to cite R or R packages in publications.

Type 'demo()' for some demos, 'help()' for on-line help, or
'help.start()' for an HTML browser interface to help.
Type 'q()' to quit R.

> library(MEDIPS)
Loading required package: BSgenome
Loading required package: BiocGenerics
Loading required package: parallel

Attaching package: 'BiocGenerics'

The following objects are masked from 'package:parallel':

    clusterApply, clusterApplyLB, clusterCall, clusterEvalQ,
    clusterExport, clusterMap, parApply, parCapply, parLapply,
    parLapplyLB, parRapply, parSapply, parSapplyLB

The following objects are masked from 'package:stats':

    IQR, mad, xtabs

The following objects are masked from 'package:base':

    Filter, Find, Map, Position, Reduce, anyDuplicated, append,
    as.data.frame, cbind, colnames, do.call, duplicated, eval, evalq,
    get, grep, grepl, intersect, is.unsorted, lapply, lengths, mapply,
    match, mget, order, paste, pmax, pmax.int, pmin, pmin.int, rank,
    rbind, rownames, sapply, setdiff, sort, table, tapply, union,
    unique, unsplit

Loading required package: S4Vectors
Loading required package: stats4

Attaching package: 'S4Vectors'

The following objects are masked from 'package:base':

    colMeans, colSums, expand.grid, rowMeans, rowSums

Loading required package: IRanges
Loading required package: GenomeInfoDb
Loading required package: GenomicRanges
Loading required package: Biostrings
Loading required package: XVector
Loading required package: rtracklayer
Loading required package: Rsamtools
> png(filename="/home/ddbj/snapshot/RGM3/R_BC/result/MEDIPS/MEDIPS.plotSaturation.Rd_%03d_medium.png", width=480, height=480)
> ### Name: MEDIPS.plotSaturation
> ### Title: Function plots the results of the MEDIPS.saturationAnalysis
> ###   function.
> ### Aliases: MEDIPS.plotSaturation
>
> ### ** Examples
>
>
> library(MEDIPSData)
> library(BSgenome.Hsapiens.UCSC.hg19)
> bam.file.hESCs.Rep1.MeDIP = system.file("extdata", "hESCs.MeDIP.Rep1.chr22.bam", package="MEDIPSData")
>
> sr=MEDIPS.saturation(file=bam.file.hESCs.Rep1.MeDIP, BSgenome="BSgenome.Hsapiens.UCSC.hg19", uniq=1e-3, extend=250, shift=0, window_size=100, chr.select="chr22", nit=10, nrit=1, empty_bins=TRUE, rank=FALSE)
Reading bam alignment hESCs.MeDIP.Rep1.chr22.bam
Selecting  chr22
Total number of imported short reads: 152586
Extending reads...
Creating GRange Object...
Keep at most 1 read(s) mapping to the same genomic location
Number of remaining reads: 150793
Loading chromosome lengths for BSgenome.Hsapiens.UCSC.hg19...
Calculating genomic coordinates...
Creating Granges object for genome wide windows...
Saturation analysis...
Random iteration: 1/1...
Processing subset 1/10...
Processing subset 2/10...
Processing subset 3/10...
Processing subset 4/10...
Processing subset 5/10...
Processing subset 6/10...
Processing subset 7/10...
Processing subset 8/10...
Processing subset 9/10...
Processing subset 10/10...
Estimated saturation analysis...
Random iteration: 1/1...
Processing subset 1/20...
Processing subset 2/20...
Processing subset 3/20...
Processing subset 4/20...
Processing subset 5/20...
Processing subset 6/20...
Processing subset 7/20...
Processing subset 8/20...
Processing subset 9/20...
Processing subset 10/20...
Processing subset 11/20...
Processing subset 12/20...
Processing subset 13/20...
Processing subset 14/20...
Processing subset 15/20...
Processing subset 16/20...
Processing subset 17/20...
Processing subset 18/20...
Processing subset 19/20...
Processing subset 20/20...
> MEDIPS.plotSaturation(saturationObj = sr, main="Saturation analysis")
>
>
>
>
>
>
> dev.off()
null device
          1
>
|
Created & Maintained by Osamu Ogasawara (osamu.ogasawara@gmail.com) and 