The coverage results object returned by the MEDIPS.seqCoverage function.
main
The title of the coverage plot.
type
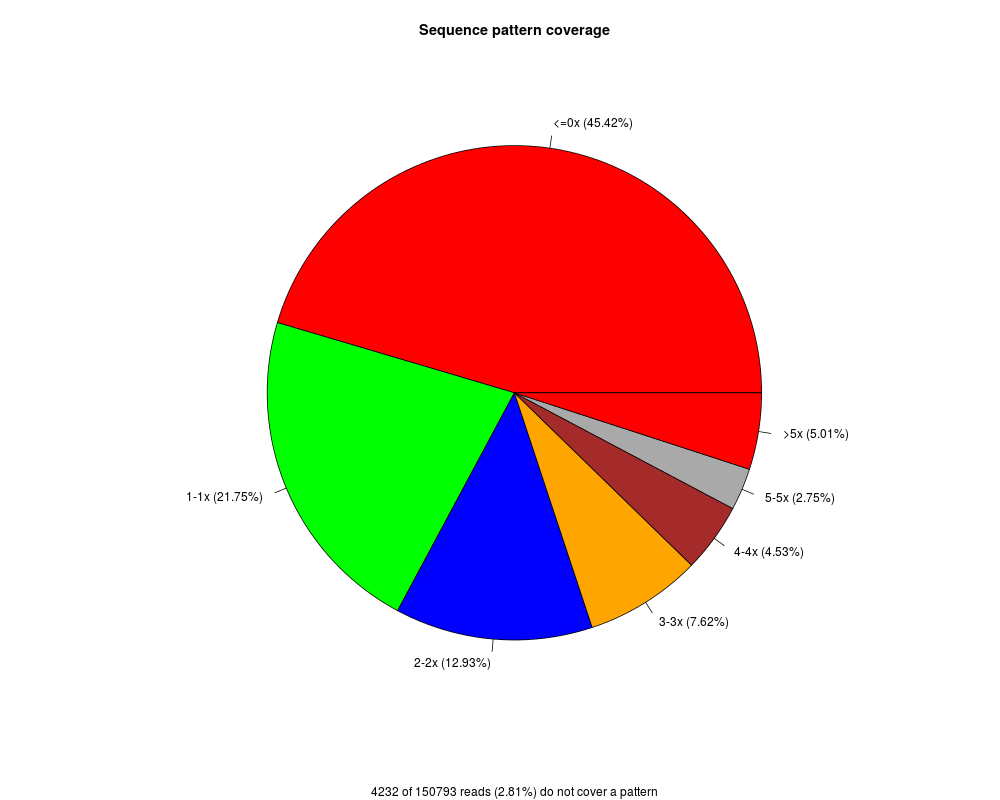
there are two types of visualization. The pie chart (default) illustrates the fraction of CpGs covered by the given reads at different coverage level (see also the parameter cov.level).
As an alternative, a histogram over all coverage level can be ploted ("hist").
cov.level
The pie chart illustrates the fraction of CpGs covered by the given reads according to their coverage level.
The visualized coverage levels can be adjusted by the cov.level parameter.
t
specifies the maximal coverage depth to be plotted, if type="hist"
Value
The sequence pattern coverage plot will be visualized.
R version 3.3.1 (2016-06-21) -- "Bug in Your Hair"
Copyright (C) 2016 The R Foundation for Statistical Computing
Platform: x86_64-pc-linux-gnu (64-bit)

R is free software and comes with ABSOLUTELY NO WARRANTY.
You are welcome to redistribute it under certain conditions.
Type 'license()' or 'licence()' for distribution details.

R is a collaborative project with many contributors.
Type 'contributors()' for more information and
'citation()' on how to cite R or R packages in publications.

Type 'demo()' for some demos, 'help()' for on-line help, or
'help.start()' for an HTML browser interface to help.
Type 'q()' to quit R.

> library(MEDIPS)
Loading required package: BSgenome
Loading required package: BiocGenerics
Loading required package: parallel

Attaching package: 'BiocGenerics'

The following objects are masked from 'package:parallel':

    clusterApply, clusterApplyLB, clusterCall, clusterEvalQ,
    clusterExport, clusterMap, parApply, parCapply, parLapply,
    parLapplyLB, parRapply, parSapply, parSapplyLB

The following objects are masked from 'package:stats':

    IQR, mad, xtabs

The following objects are masked from 'package:base':

    Filter, Find, Map, Position, Reduce, anyDuplicated, append,
    as.data.frame, cbind, colnames, do.call, duplicated, eval, evalq,
    get, grep, grepl, intersect, is.unsorted, lapply, lengths, mapply,
    match, mget, order, paste, pmax, pmax.int, pmin, pmin.int, rank,
    rbind, rownames, sapply, setdiff, sort, table, tapply, union,
    unique, unsplit

Loading required package: S4Vectors
Loading required package: stats4

Attaching package: 'S4Vectors'

The following objects are masked from 'package:base':

    colMeans, colSums, expand.grid, rowMeans, rowSums

Loading required package: IRanges
Loading required package: GenomeInfoDb
Loading required package: GenomicRanges
Loading required package: Biostrings
Loading required package: XVector
Loading required package: rtracklayer
Loading required package: Rsamtools
> png(filename="/home/ddbj/snapshot/RGM3/R_BC/result/MEDIPS/MEDIPS.plotSeqCoverage.Rd_%03d_medium.png", width=480, height=480)
> ### Name: MEDIPS.plotSeqCoverage
> ### Title: Function plots the results of the MEDIPS.seqCoverage function.
> ### Aliases: MEDIPS.plotSeqCoverage
>
> ### ** Examples
>
>
> library(MEDIPSData)
> library(BSgenome.Hsapiens.UCSC.hg19)
> bam.file.hESCs.Rep1.MeDIP = system.file("extdata", "hESCs.MeDIP.Rep1.chr22.bam", package="MEDIPSData")
>
> cr=MEDIPS.seqCoverage(file=bam.file.hESCs.Rep1.MeDIP, pattern="CG", BSgenome="BSgenome.Hsapiens.UCSC.hg19", chr.select="chr22", extend=250, shift=0, uniq=1e-3, paired=FALSE)
Reading bam alignment hESCs.MeDIP.Rep1.chr22.bam
Selecting  chr22
Total number of imported short reads: 152586
Extending reads...
Creating GRange Object...
Keep at most 1 read(s) mapping to the same genomic location
Number of remaining reads: 150793
Loading chromosome lengths for BSgenome.Hsapiens.UCSC.hg19...
Get genomic sequence pattern positions...
Searching in chr22 ...[ 578097 ] found.
Number of identified  CG  pattern:  578097
Calculating sequence pattern coverage...
>
> MEDIPS.plotSeqCoverage(seqCoverageObj=cr, main="Sequence pattern coverage", type="pie", cov.level = c(0,1,2,3,4,5))
Creating summary...
>
>
>
>
>
>
>
> dev.off()
null device
          1
>
 .
.