Supported by Dr. Osamu Ogasawara and  . . |
|
Last data update: 2014.03.03 |
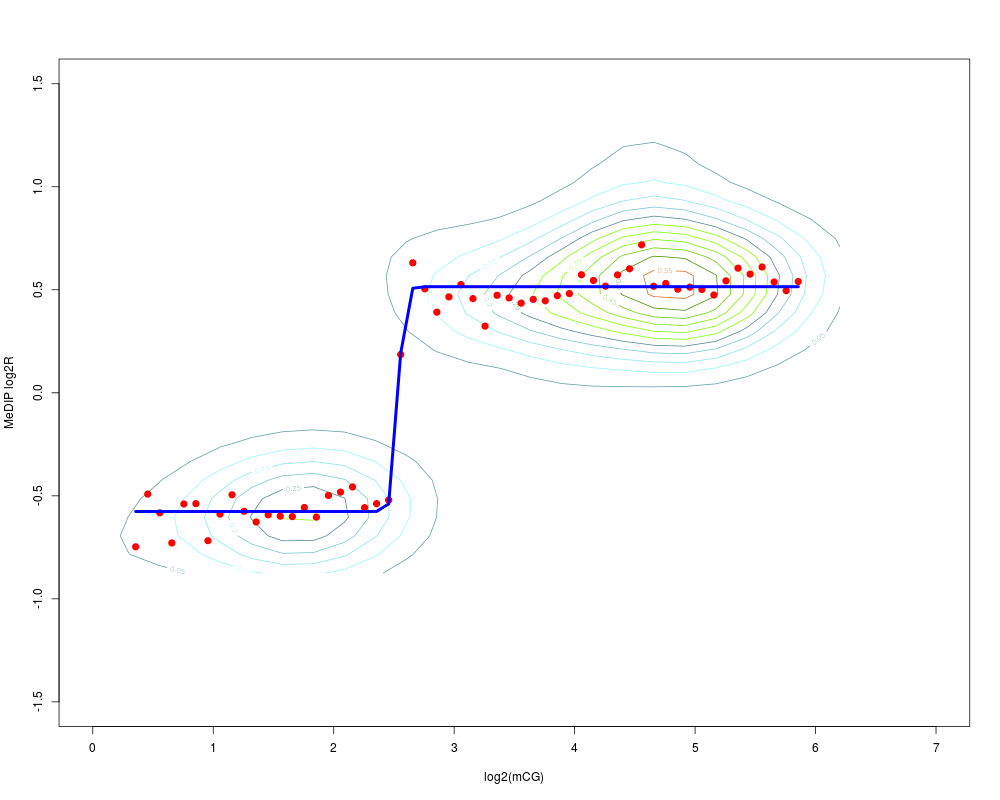
Applying the logistic model on MeDIP enrichment dataDescriptionThis allows the probe-level determination of MeDIP smoothed data, as well as absolute and relative methylation levels (AMS and RMS respectively) UsageMEDME.predict(data, MEDMEfit, MEDMEextremes = c(1,32), wsize = 1000, wFunction='linear') Arguments
ValueAn object of class MEDMEset. The resulting smoothed data, the absolute and relative methylation score (AMS and RMS) are saved in the smoothed, AMS and RMS slots, respectively. Referenceshttp://genome.cshlp.org/cgi/content/abstract/gr.080721.108v1 See Also
Examplesdata(testMEDMEset) ## just an example with the first 1000 probes testMEDMEset = smooth(data = testMEDMEset[1:1000, ]) library(BSgenome.Hsapiens.UCSC.hg18) testMEDMEset = CGcount(data = testMEDMEset) MEDMEmodel = MEDME(data = testMEDMEset, sample = 1, CGcountThr = 1, figName = NULL) testMEDMEset = MEDME.predict(data = testMEDMEset, MEDMEfit = MEDMEmodel, MEDMEextremes = c(1,32), wsize = 1000, wFunction='linear') Results
R version 3.3.1 (2016-06-21) -- "Bug in Your Hair"
Copyright (C) 2016 The R Foundation for Statistical Computing
Platform: x86_64-pc-linux-gnu (64-bit)

R is free software and comes with ABSOLUTELY NO WARRANTY.
You are welcome to redistribute it under certain conditions.
Type 'license()' or 'licence()' for distribution details.

R is a collaborative project with many contributors.
Type 'contributors()' for more information and
'citation()' on how to cite R or R packages in publications.

Type 'demo()' for some demos, 'help()' for on-line help, or
'help.start()' for an HTML browser interface to help.
Type 'q()' to quit R.

> library(MEDME)

Attaching package: 'MEDME'

The following object is masked from 'package:stats':

    smooth

> png(filename="/home/ddbj/snapshot/RGM3/R_BC/result/MEDME/MEDME.predict.Rd_%03d_medium.png", width=480, height=480)
> ### Name: MEDME.predict
> ### Title: Applying the logistic model on MeDIP enrichment data
> ### Aliases: MEDME.predict
>
> ### ** Examples
>
> data(testMEDMEset)
> ## just an example with the first 1000 probes
> testMEDMEset = smooth(data = testMEDMEset[1:1000, ])
chrX
> library(BSgenome.Hsapiens.UCSC.hg18)
Loading required package: BSgenome
Loading required package: BiocGenerics
Loading required package: parallel

Attaching package: 'BiocGenerics'

The following objects are masked from 'package:parallel':

    clusterApply, clusterApplyLB, clusterCall, clusterEvalQ,
    clusterExport, clusterMap, parApply, parCapply, parLapply,
    parLapplyLB, parRapply, parSapply, parSapplyLB

The following objects are masked from 'package:stats':

    IQR, mad, xtabs

The following objects are masked from 'package:base':

    Filter, Find, Map, Position, Reduce, anyDuplicated, append,
    as.data.frame, cbind, colnames, do.call, duplicated, eval, evalq,
    get, grep, grepl, intersect, is.unsorted, lapply, lengths, mapply,
    match, mget, order, paste, pmax, pmax.int, pmin, pmin.int, rank,
    rbind, rownames, sapply, setdiff, sort, table, tapply, union,
    unique, unsplit

Loading required package: S4Vectors
Loading required package: stats4

Attaching package: 'S4Vectors'

The following objects are masked from 'package:base':

    colMeans, colSums, expand.grid, rowMeans, rowSums

Loading required package: IRanges
Loading required package: GenomeInfoDb
Loading required package: GenomicRanges

Attaching package: 'GenomicRanges'

The following object is masked from 'package:MEDME':

    pos

Loading required package: Biostrings
Loading required package: XVector
Loading required package: rtracklayer
> testMEDMEset = CGcount(data = testMEDMEset)
chrX
> MEDMEmodel = MEDME(data = testMEDMEset, sample = 1, CGcountThr = 1, figName = NULL)
> testMEDMEset = MEDME.predict(data = testMEDMEset, MEDMEfit = MEDMEmodel, MEDMEextremes = c(1,32), wsize = 1000, wFunction='linear')
[1] "chrX"
done
>
>
>
>
>
> dev.off()
null device
          1
>
|