Supported by Dr. Osamu Ogasawara and  . . |
|
Last data update: 2014.03.03 |
create learned tesselation of feature space after PC transformationDescriptioncreate learned tesselation of feature space after PC transformation UsageprojectLearnerToGrid(formula, data, learnerSchema, trainInds, ..., dropIntercept = TRUE, ngpts = 20, predExtras = list(), predWrapper = force) Arguments
Valueinstance of Author(s)VJ Carey <stvjc@channing.harvard.edu> Referencesnone. Examples
library(mlbench)
# demostrate with 3 dimensional hypercube problem
kk = mlbench.hypercube()
colnames(kk$x) = c("f1", "f2", "f3")
hcu = data.frame(cl=kk$classes, kk$x)
library(MLInterfaces)
set.seed(1234)
sam = sample(1:nrow(kk$x), size=nrow(kk$x)/2)
ldap = projectLearnerToGrid(cl~., data=hcu, ldaI,
sam, predWrapper=function(x)x$class)
plot(ldap)
confuMat(ldap@fittedLearner)
nnetp = projectLearnerToGrid(cl~., data=hcu, nnetI, sam, size=2,
decay=.01, predExtras=list(type="class"))
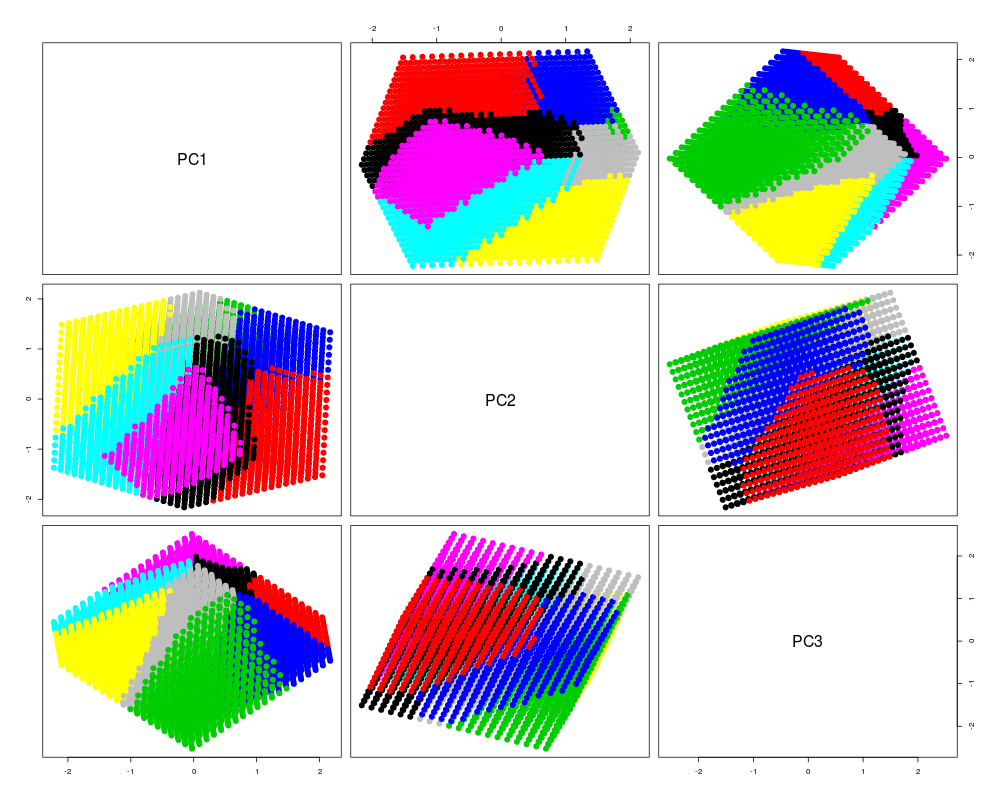
plot(nnetp)
confuMat(nnetp@fittedLearner)
if (require(rgl) && interactive()) {
learnerIn3D(nnetp)
## customising the rgl plot
learnerIn3D(nnetp, size = 10, alpha = 0.1)
}
Results
R version 3.3.1 (2016-06-21) -- "Bug in Your Hair"
Copyright (C) 2016 The R Foundation for Statistical Computing
Platform: x86_64-pc-linux-gnu (64-bit)

R is free software and comes with ABSOLUTELY NO WARRANTY.
You are welcome to redistribute it under certain conditions.
Type 'license()' or 'licence()' for distribution details.

R is a collaborative project with many contributors.
Type 'contributors()' for more information and
'citation()' on how to cite R or R packages in publications.

Type 'demo()' for some demos, 'help()' for on-line help, or
'help.start()' for an HTML browser interface to help.
Type 'q()' to quit R.

> library(MLInterfaces)
Loading required package: BiocGenerics
Loading required package: parallel

Attaching package: 'BiocGenerics'

The following objects are masked from 'package:parallel':

    clusterApply, clusterApplyLB, clusterCall, clusterEvalQ,
    clusterExport, clusterMap, parApply, parCapply, parLapply,
    parLapplyLB, parRapply, parSapply, parSapplyLB

The following objects are masked from 'package:stats':

    IQR, mad, xtabs

The following objects are masked from 'package:base':

    Filter, Find, Map, Position, Reduce, anyDuplicated, append,
    as.data.frame, cbind, colnames, do.call, duplicated, eval, evalq,
    get, grep, grepl, intersect, is.unsorted, lapply, lengths, mapply,
    match, mget, order, paste, pmax, pmax.int, pmin, pmin.int, rank,
    rbind, rownames, sapply, setdiff, sort, table, tapply, union,
    unique, unsplit

Loading required package: Biobase
Welcome to Bioconductor

    Vignettes contain introductory material; view with
    'browseVignettes()'. To cite Bioconductor, see
    'citation("Biobase")', and for packages 'citation("pkgname")'.

Loading required package: annotate
Loading required package: AnnotationDbi
Loading required package: stats4
Loading required package: IRanges
Loading required package: S4Vectors

Attaching package: 'S4Vectors'

The following objects are masked from 'package:base':

    colMeans, colSums, expand.grid, rowMeans, rowSums

Loading required package: XML
Loading required package: cluster
> png(filename="/home/ddbj/snapshot/RGM3/R_BC/result/MLInterfaces/projectLearnerToGrid.Rd_%03d_medium.png", width=480, height=480)
> ### Name: projectLearnerToGrid
> ### Title: create learned tesselation of feature space after PC
> ###   transformation
> ### Aliases: projectLearnerToGrid
> ### Keywords: models
>
> ### ** Examples
>
> library(mlbench)
> # demostrate with 3 dimensional hypercube problem
> kk = mlbench.hypercube()
> colnames(kk$x) = c("f1", "f2", "f3")
> hcu = data.frame(cl=kk$classes, kk$x)
> library(MLInterfaces)
> set.seed(1234)
> sam = sample(1:nrow(kk$x), size=nrow(kk$x)/2)
> ldap = projectLearnerToGrid(cl~., data=hcu, ldaI,
+    sam, predWrapper=function(x)x$class)
> plot(ldap)
> confuMat(ldap@fittedLearner)
     predicted
given  1  2  3  4  5  6  7  8
    1 52  0  0  0  0  0  0  0
    2  0 46  0  0  0  0  0  0
    3  0  0 48  0  0  0  0  0
    4  0  0  0 49  0  0  0  0
    5  0  0  0  0 48  0  0  0
    6  0  0  0  0  0 60  0  0
    7  0  0  0  0  0  0 49  0
    8  0  0  0  0  0  0  0 48
> nnetp = projectLearnerToGrid(cl~., data=hcu, nnetI, sam, size=2,
+    decay=.01, predExtras=list(type="class"))
# weights:  32
initial  value 879.124242
iter  10 value 537.867300
iter  20 value 278.335814
iter  30 value 200.506618
iter  40 value 124.228815
iter  50 value 87.530174
iter  60 value 82.074509
iter  70 value 81.194623
iter  80 value 80.135361
iter  90 value 75.951414
iter 100 value 75.523763
final  value 75.523763
stopped after 100 iterations
> plot(nnetp)
> confuMat(nnetp@fittedLearner)
     predicted
given  1  2  3  4  5  6  7  8
    1 52  0  0  0  0  0  0  0
    2  0 46  0  0  0  0  0  0
    3  0  1 47  0  0  0  0  0
    4  0  0  0 49  0  0  0  0
    5  0  0  0  0 48  0  0  0
    6  0  0  1  0  0 58  1  0
    7  0  0  0  0  0  0 49  0
    8  0  0  0  0  0  0  0 48
> #if (require(rgl) && interactive()) {
>     learnerIn3D(nnetp)
>     ## customising the rgl plot
>     learnerIn3D(nnetp, size = 10, alpha = 0.1)
> #}
>
>
>
>
>
> dev.off()
null device
          1
>
|