Last data update: 2014.03.03

R: Plot a representation of the patterns and their frequencies
patternMapR Documentation

Plot a representation of the patterns and their frequencies

Description

Plot the observed distribution and the estimated distribution of the methylation patterns

Usage

  patternMap(patterns,
             minFreq=0,
             maxFreq=1,
             noSpurious=TRUE,
             estimatedDistribution=TRUE,
             topDown=TRUE,
             allTicks=FALSE,
             methCol='black',
             unMethCol='white',
             ...)

Arguments

patterns

A data frame obtained from the output of the function estimatePatterns.

minFreq

Only plot patterns with at least minFreq frequency.

maxFreq

Only plot patterns with more maxFreq frequency or more.

noSpurious

Don't plot spurious patterns (only relevant if estimatedDistribution is FALSE).

estimatedDistribution

Use the frequencies from the estimated distribution. If FALSE, use the observed distribution.

topDown

Put the most abundant patterns at the top. If FALSE the most abundant patterns are at the bottom.

allTicks

Draw a tick under every position.

methCol

The colour for the methylated positions. Can be a single colour, a vector of colours (recycled), or a function (for instance from colorRampPalette).

unMethCol

As methCol but for un-methylated positions.

...

Other arguments passed to plot

Details

This function draws a map of the different pattern and their frequencies based on the values returned by estimatePatterns.

Author(s)

Peijie Lin, Sylvain Foret, Conrad Burden

Examples

  data(patternsExample)
  estimates <- estimatePatterns(patternsExample, 
                                epsilon=0.02, 
                                eta=0.01)
  patternMap(estimates[[1]])

Results


R version 3.3.1 (2016-06-21) -- "Bug in Your Hair"
Copyright (C) 2016 The R Foundation for Statistical Computing
Platform: x86_64-pc-linux-gnu (64-bit)

R is free software and comes with ABSOLUTELY NO WARRANTY.
You are welcome to redistribute it under certain conditions.
Type 'license()' or 'licence()' for distribution details.

R is a collaborative project with many contributors.
Type 'contributors()' for more information and
'citation()' on how to cite R or R packages in publications.

Type 'demo()' for some demos, 'help()' for on-line help, or
'help.start()' for an HTML browser interface to help.
Type 'q()' to quit R.

> library(MPFE)
> png(filename="/home/ddbj/snapshot/RGM3/R_BC/result/MPFE/patternMap.Rd_%03d_medium.png", width=480, height=480)
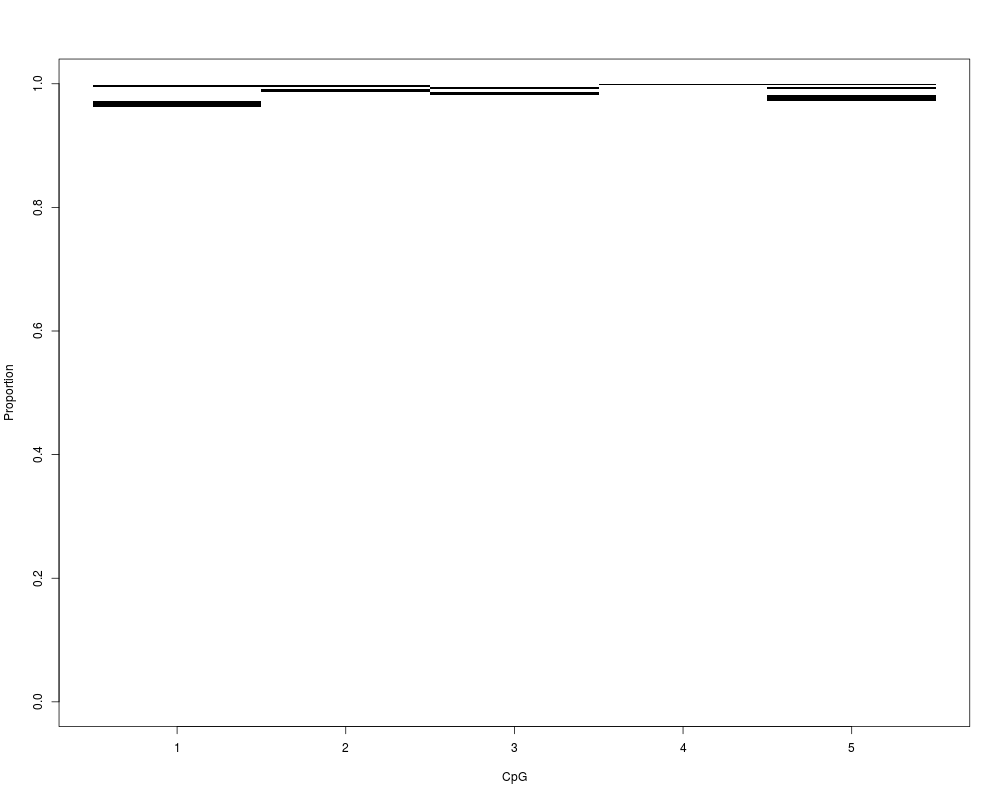
> ### Name: patternMap
> ### Title: Plot a representation of the patterns and their frequencies
> ### Aliases: patternMap
> 
> ### ** Examples
> 
>   data(patternsExample)
>   estimates <- estimatePatterns(patternsExample, 
+                                 epsilon=0.02, 
+                                 eta=0.01)
>   patternMap(estimates[[1]])
> 
> 
> 
> 
> 
> dev.off()
null device 
          1 
>