Supported by Dr. Osamu Ogasawara and  . . |
|
Last data update: 2014.03.03 |
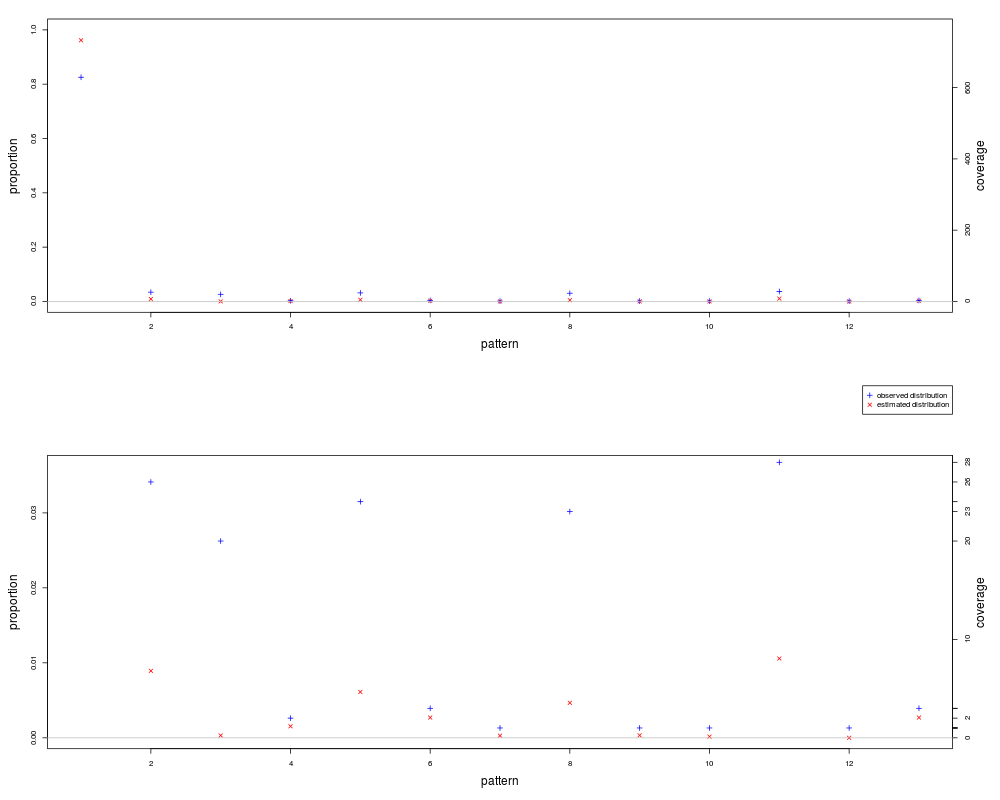
Plot methylation pattern distributionDescriptionPlot the observed distribution and the estimated distribution of the methylation patterns UsageplotPatterns(compareData, yLimit1=NULL, yLimit2=NULL) Arguments
DetailsThe two graphs in the output plot are the same but have different ranges. The parameters yLimit1 and yLimit2 control the range of the y_axis on the plots produced. ValueA plot that compares the observed read distribution with the estimated distribution. Author(s)Peijie Lin, Sylvain Foret, Conrad Burden Examples
  data(patternsExample)
  estimates <- estimatePatterns(patternsExample,
                                epsilon=0.02,
                                eta=0.01)
  plotPatterns(estimates[[1]])
Results
R version 3.3.1 (2016-06-21) -- "Bug in Your Hair"
Copyright (C) 2016 The R Foundation for Statistical Computing
Platform: x86_64-pc-linux-gnu (64-bit)

R is free software and comes with ABSOLUTELY NO WARRANTY.
You are welcome to redistribute it under certain conditions.
Type 'license()' or 'licence()' for distribution details.

R is a collaborative project with many contributors.
Type 'contributors()' for more information and
'citation()' on how to cite R or R packages in publications.

Type 'demo()' for some demos, 'help()' for on-line help, or
'help.start()' for an HTML browser interface to help.
Type 'q()' to quit R.

> library(MPFE)
> png(filename="/home/ddbj/snapshot/RGM3/R_BC/result/MPFE/plotPatterns.Rd_%03d_medium.png", width=480, height=480)
> ### Name: plotPatterns
> ### Title: Plot methylation pattern distribution
> ### Aliases: plotPatterns
>
> ### ** Examples
>
>   data(patternsExample)
>   estimates <- estimatePatterns(patternsExample,
+                                 epsilon=0.02,
+                                 eta=0.01)
>   plotPatterns(estimates[[1]])
>
>
>
>
>
> dev.off()
null device
          1
>
|
Created & Maintained by Osamu Ogasawara (osamu.ogasawara@gmail.com) and 