Supported by Dr. Osamu Ogasawara and  . . |
|
Last data update: 2014.03.03 |
Plots a chromatogramDescriptionThe method plot the chromatogram for various types in inputs (see below). Additional arguments are
xcms::plotChrom provides a similar functionality. ValueThe methods invisibly return the Methods
Examples
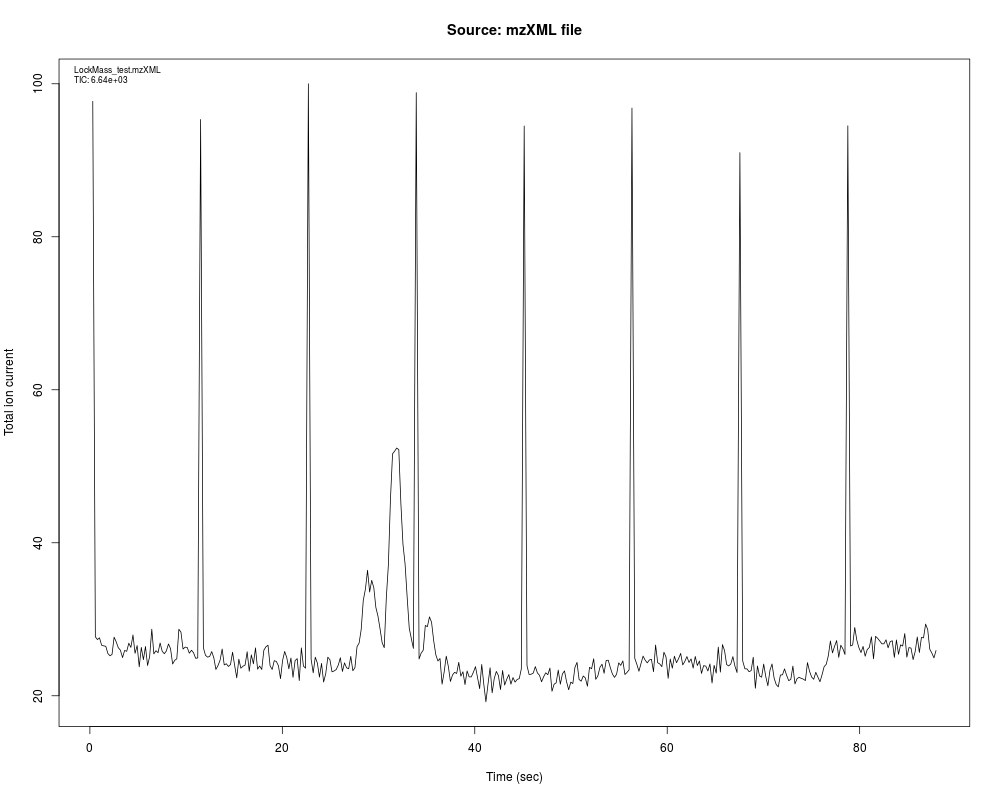
f <- system.file("lockmass/LockMass_test.mzXML", package = "msdata")
x <- chromatogram(f, main = "Source: mzXML file")
head(x)
dim(x)
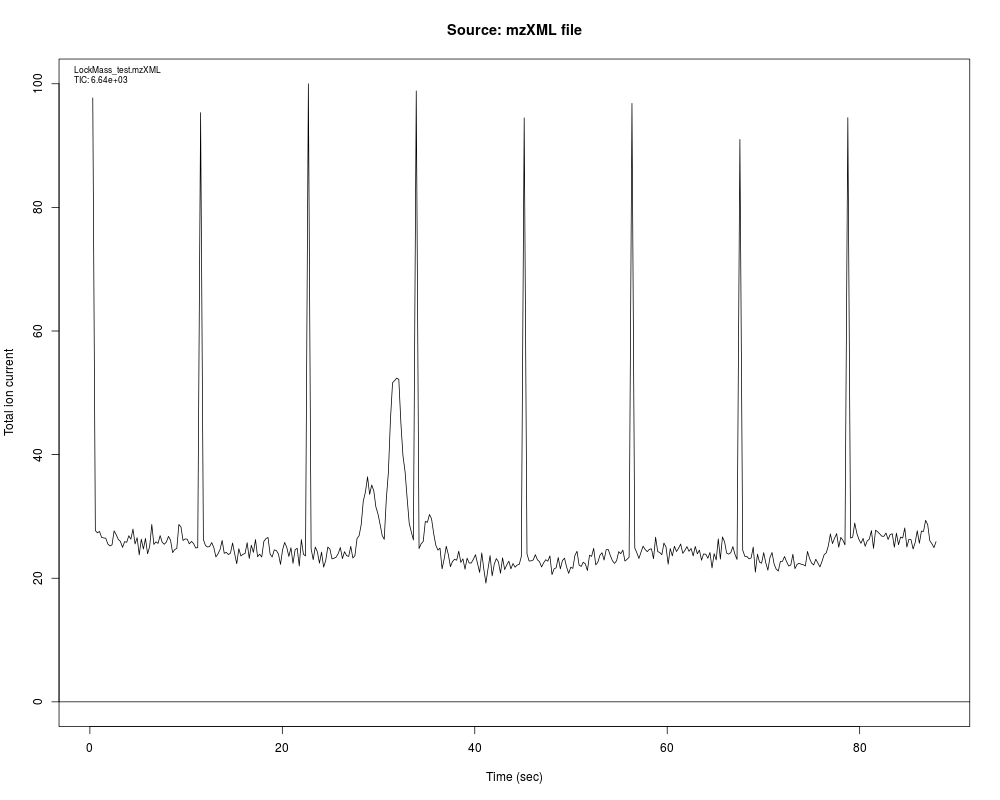
x <- chromatogram(f, main = "Source: mzXML file",
ylim = c(0, 100))
## Not run:
library("mzR")
ms <- openMSfile(f)
chromatogram(ms, main = "Source: mzRramp",
col = "red")
hd <- header(ms)
chromatogram(hd, main = "Source: mzRramp header",
lty = "dashed")
library("RforProteomics")
f <- getPXD000001mzXML()
chromatogram(f)
grid()
## End(Not run)
Results
R version 3.3.1 (2016-06-21) -- "Bug in Your Hair"
Copyright (C) 2016 The R Foundation for Statistical Computing
Platform: x86_64-pc-linux-gnu (64-bit)

R is free software and comes with ABSOLUTELY NO WARRANTY.
You are welcome to redistribute it under certain conditions.
Type 'license()' or 'licence()' for distribution details.

R is a collaborative project with many contributors.
Type 'contributors()' for more information and
'citation()' on how to cite R or R packages in publications.

Type 'demo()' for some demos, 'help()' for on-line help, or
'help.start()' for an HTML browser interface to help.
Type 'q()' to quit R.

> library(MSnbase)
Loading required package: BiocGenerics
Loading required package: parallel

Attaching package: 'BiocGenerics'

The following objects are masked from 'package:parallel':

    clusterApply, clusterApplyLB, clusterCall, clusterEvalQ,
    clusterExport, clusterMap, parApply, parCapply, parLapply,
    parLapplyLB, parRapply, parSapply, parSapplyLB

The following objects are masked from 'package:stats':

    IQR, mad, xtabs

The following objects are masked from 'package:base':

    Filter, Find, Map, Position, Reduce, anyDuplicated, append,
    as.data.frame, cbind, colnames, do.call, duplicated, eval, evalq,
    get, grep, grepl, intersect, is.unsorted, lapply, lengths, mapply,
    match, mget, order, paste, pmax, pmax.int, pmin, pmin.int, rank,
    rbind, rownames, sapply, setdiff, sort, table, tapply, union,
    unique, unsplit

Loading required package: Biobase
Welcome to Bioconductor

    Vignettes contain introductory material; view with
    'browseVignettes()'. To cite Bioconductor, see
    'citation("Biobase")', and for packages 'citation("pkgname")'.

Loading required package: mzR
Loading required package: Rcpp
Loading required package: BiocParallel
Loading required package: ProtGenerics

This is MSnbase version 1.20.7
  Read '?MSnbase' and references therein for information
  about the package and how to get started.


Attaching package: 'MSnbase'

The following object is masked from 'package:stats':

    smooth

The following object is masked from 'package:base':

    trimws

> png(filename="/home/ddbj/snapshot/RGM3/R_BC/result/MSnbase/chromatogram-methods.Rd_%03d_medium.png", width=480, height=480)
> ### Name: chromatogram-methods
> ### Title: Plots a chromatogram
> ### Aliases: chromatogram-methods chromatogram,data.frame-method
> ###   chromatogram,character-method chromatogram,mzRramp-method
> ###   chromatogram
> ### Keywords: methods
>
> ### ** Examples
>
> f <- system.file("lockmass/LockMass_test.mzXML", package = "msdata")
> x <- chromatogram(f, main = "Source: mzXML file")
> head(x)
     rt      tic
1 0.300 97.70424
2 0.568 27.70334
3 0.784 27.34622
4 1.001 27.57260
5 1.217 26.60848
6 1.434 26.51795
> dim(x)
[1] 400   2
> x <- chromatogram(f, main = "Source: mzXML file",
+                   ylim = c(0, 100))
> ## Not run:
> ##D     library("mzR")
> ##D     ms <- openMSfile(f)
> ##D     chromatogram(ms, main = "Source: mzRramp",
> ##D                  col = "red")
> ##D     hd <- header(ms)
> ##D     chromatogram(hd, main = "Source: mzRramp header",
> ##D                  lty = "dashed")
> ##D
> ##D     library("RforProteomics")
> ##D     f <- getPXD000001mzXML()
> ##D     chromatogram(f)
> ##D     grid()
> ##D
> ## End(Not run)
>
>
>
>
>
> dev.off()
null device
          1
>
|