Supported by Dr. Osamu Ogasawara and  . . |
|
Last data update: 2014.03.03 |
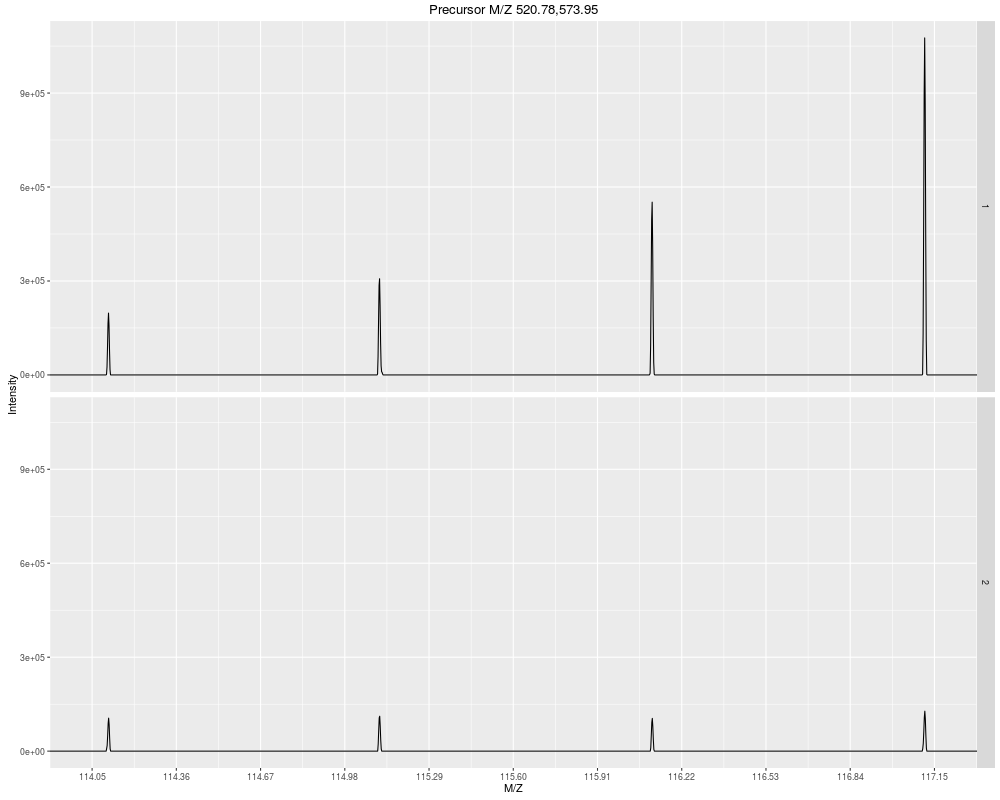
Plotting 'Spectrum' object(s)DescriptionThese method plot mass spectra MZ values against the intensities. Full
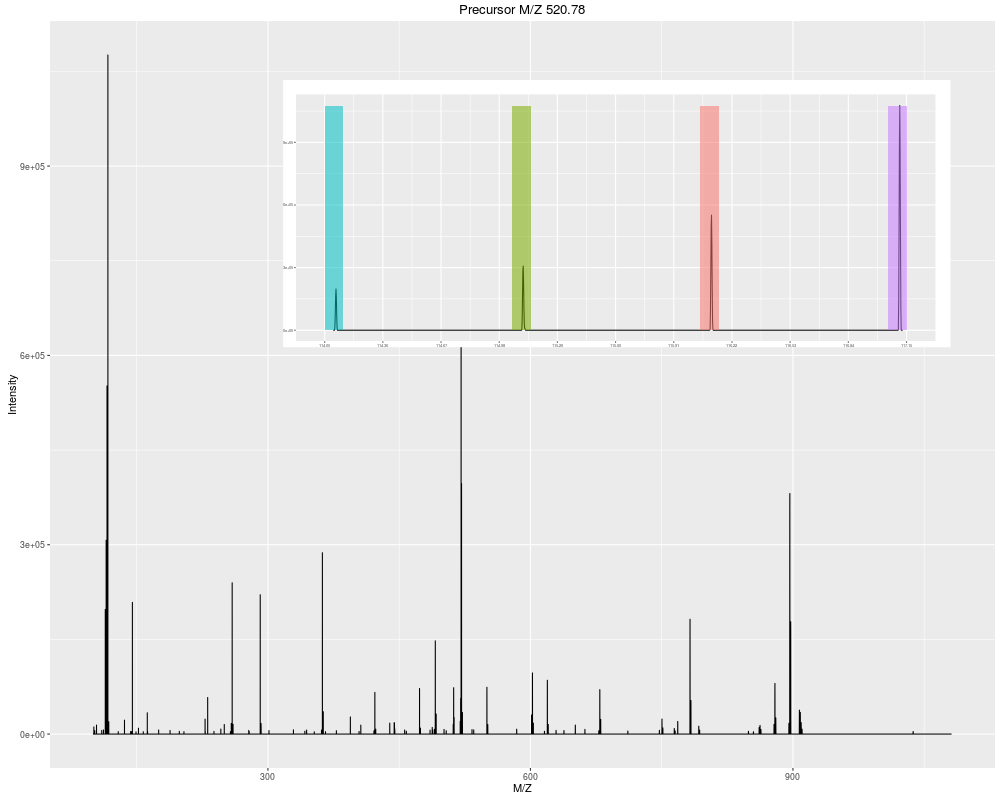
spectra (using the If an The methods make use the If a single Arguments
See below for more details. Methods
Author(s)Laurent Gatto <lg390@cam.ac.uk> and Sebastian Gibb See Also
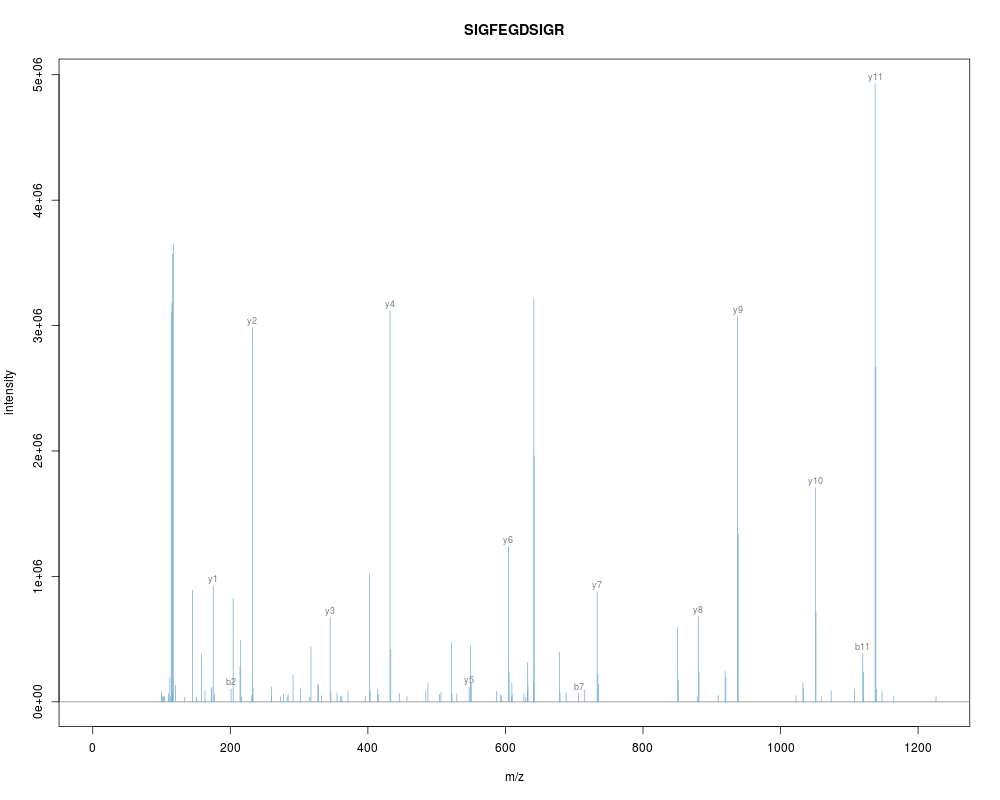
Examplesdata(itraqdata) ## plotting experiments plot(itraqdata[1:2], reporters = iTRAQ4) plot(itraqdata[1:2], full = TRUE) ## plotting spectra plot(itraqdata[[1]],reporters = iTRAQ4, full = TRUE) itraqdata2 <- pickPeaks(itraqdata) i <- 14 s <- as.character(fData(itraqdata2)[i, "PeptideSequence"]) plot(itraqdata2[[i]], s, main = s) Results
R version 3.3.1 (2016-06-21) -- "Bug in Your Hair"
Copyright (C) 2016 The R Foundation for Statistical Computing
Platform: x86_64-pc-linux-gnu (64-bit)
R is free software and comes with ABSOLUTELY NO WARRANTY.
You are welcome to redistribute it under certain conditions.
Type 'license()' or 'licence()' for distribution details.
R is a collaborative project with many contributors.
Type 'contributors()' for more information and
'citation()' on how to cite R or R packages in publications.
Type 'demo()' for some demos, 'help()' for on-line help, or
'help.start()' for an HTML browser interface to help.
Type 'q()' to quit R.
> library(MSnbase)
Loading required package: BiocGenerics
Loading required package: parallel
Attaching package: 'BiocGenerics'
The following objects are masked from 'package:parallel':
clusterApply, clusterApplyLB, clusterCall, clusterEvalQ,
clusterExport, clusterMap, parApply, parCapply, parLapply,
parLapplyLB, parRapply, parSapply, parSapplyLB
The following objects are masked from 'package:stats':
IQR, mad, xtabs
The following objects are masked from 'package:base':
Filter, Find, Map, Position, Reduce, anyDuplicated, append,
as.data.frame, cbind, colnames, do.call, duplicated, eval, evalq,
get, grep, grepl, intersect, is.unsorted, lapply, lengths, mapply,
match, mget, order, paste, pmax, pmax.int, pmin, pmin.int, rank,
rbind, rownames, sapply, setdiff, sort, table, tapply, union,
unique, unsplit
Loading required package: Biobase
Welcome to Bioconductor
Vignettes contain introductory material; view with
'browseVignettes()'. To cite Bioconductor, see
'citation("Biobase")', and for packages 'citation("pkgname")'.
Loading required package: mzR
Loading required package: Rcpp
Loading required package: BiocParallel
Loading required package: ProtGenerics
This is MSnbase version 1.20.7
Read '?MSnbase' and references therein for information
about the package and how to get started.
Attaching package: 'MSnbase'
The following object is masked from 'package:stats':
smooth
The following object is masked from 'package:base':
trimws
> png(filename="/home/ddbj/snapshot/RGM3/R_BC/result/MSnbase/plot-methods.Rd_%03d_medium.png", width=480, height=480)
> ### Name: plot-methods
> ### Title: Plotting 'Spectrum' object(s)
> ### Aliases: plot,Spectrum-method plot,Spectrum,missing-method
> ### plot,Spectrum2,character-method plot-methods plot.MSnExp
> ### plot.Spectrum plot.Spectrum.character plot
> ### Keywords: methods
>
> ### ** Examples
>
> data(itraqdata)
> ## plotting experiments
> plot(itraqdata[1:2], reporters = iTRAQ4)
> plot(itraqdata[1:2], full = TRUE)
> ## plotting spectra
> plot(itraqdata[[1]],reporters = iTRAQ4, full = TRUE)
>
> itraqdata2 <- pickPeaks(itraqdata)
| | | 0% | |= | 2% | |=== | 4% | |==== | 5% | |===== | 7% | |====== | 9% | |======== | 11% | |========= | 13% | |========== | 15% | |=========== | 16% | |============= | 18% | |============== | 20% | |=============== | 22% | |================= | 24% | |================== | 25% | |=================== | 27% | |==================== | 29% | |====================== | 31% | |======================= | 33% | |======================== | 35% | |========================= | 36% | |=========================== | 38% | |============================ | 40% | |============================= | 42% | |=============================== | 44% | |================================ | 45% | |================================= | 47% | |================================== | 49% | |==================================== | 51% | |===================================== | 53% | |====================================== | 55% | |======================================= | 56% | |========================================= | 58% | |========================================== | 60% | |=========================================== | 62% | |============================================= | 64% | |============================================== | 65% | |=============================================== | 67% | |================================================ | 69% | |================================================== | 71% | |=================================================== | 73% | |==================================================== | 75% | |===================================================== | 76% | |======================================================= | 78% | |======================================================== | 80% | |========================================================= | 82% | |=========================================================== | 84% | |============================================================ | 85% | |============================================================= | 87% | |============================================================== | 89% | |================================================================ | 91% | |================================================================= | 93% | |================================================================== | 95% | |=================================================================== | 96% | |===================================================================== | 98% | |======================================================================| 100%
> i <- 14
> s <- as.character(fData(itraqdata2)[i, "PeptideSequence"])
> plot(itraqdata2[[i]], s, main = s)
>
>
>
>
>
> dev.off()
null device
1
>
|