Supported by Dr. Osamu Ogasawara and  . . |
|
Last data update: 2014.03.03 |
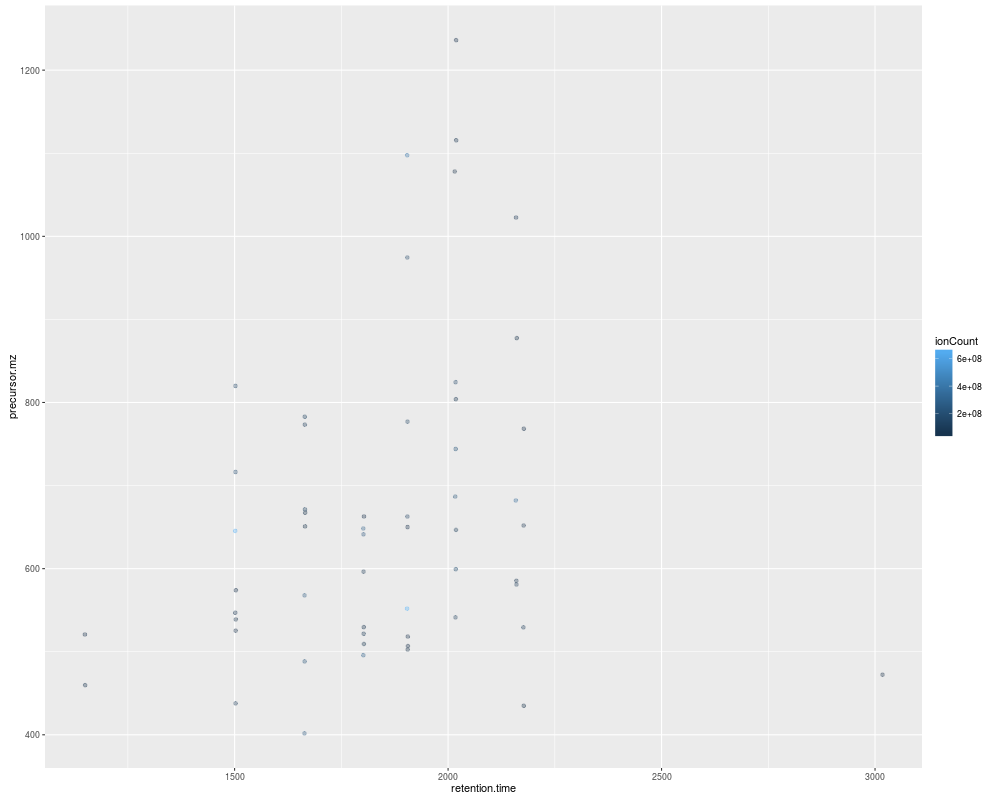
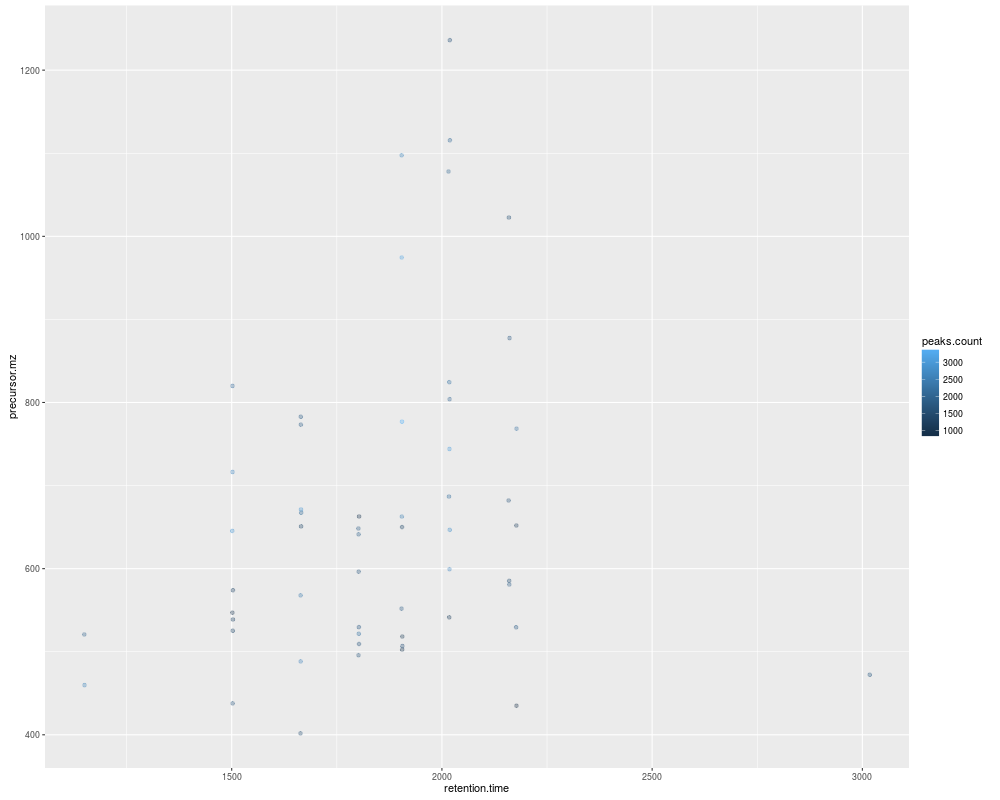
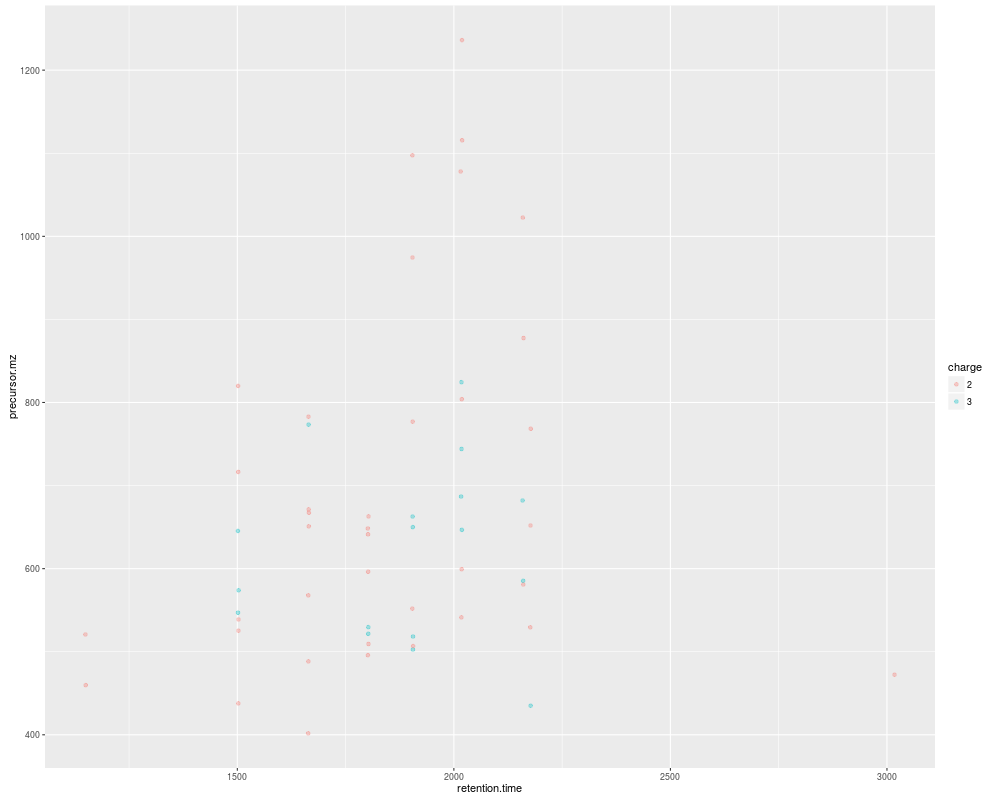
The 'plot2d' method for 'MSnExp' quality assessmentDescriptionThese methods plot the retention time vs. precursor MZ for the whole
The methods make use the Arguments
Methods
Author(s)Laurent Gatto <lg390@cam.ac.uk> See AlsoThe Examplesitraqdata plot2d(itraqdata,z="ionCount") plot2d(itraqdata,z="peaks.count") plot2d(itraqdata,z="charge") Results
R version 3.3.1 (2016-06-21) -- "Bug in Your Hair"
Copyright (C) 2016 The R Foundation for Statistical Computing
Platform: x86_64-pc-linux-gnu (64-bit)

R is free software and comes with ABSOLUTELY NO WARRANTY.
You are welcome to redistribute it under certain conditions.
Type 'license()' or 'licence()' for distribution details.

R is a collaborative project with many contributors.
Type 'contributors()' for more information and
'citation()' on how to cite R or R packages in publications.

Type 'demo()' for some demos, 'help()' for on-line help, or
'help.start()' for an HTML browser interface to help.
Type 'q()' to quit R.

> library(MSnbase)
Loading required package: BiocGenerics
Loading required package: parallel

Attaching package: 'BiocGenerics'

The following objects are masked from 'package:parallel':

    clusterApply, clusterApplyLB, clusterCall, clusterEvalQ,
    clusterExport, clusterMap, parApply, parCapply, parLapply,
    parLapplyLB, parRapply, parSapply, parSapplyLB

The following objects are masked from 'package:stats':

    IQR, mad, xtabs

The following objects are masked from 'package:base':

    Filter, Find, Map, Position, Reduce, anyDuplicated, append,
    as.data.frame, cbind, colnames, do.call, duplicated, eval, evalq,
    get, grep, grepl, intersect, is.unsorted, lapply, lengths, mapply,
    match, mget, order, paste, pmax, pmax.int, pmin, pmin.int, rank,
    rbind, rownames, sapply, setdiff, sort, table, tapply, union,
    unique, unsplit

Loading required package: Biobase
Welcome to Bioconductor

    Vignettes contain introductory material; view with
    'browseVignettes()'. To cite Bioconductor, see
    'citation("Biobase")', and for packages 'citation("pkgname")'.

Loading required package: mzR
Loading required package: Rcpp
Loading required package: BiocParallel
Loading required package: ProtGenerics

This is MSnbase version 1.20.7
  Read '?MSnbase' and references therein for information
  about the package and how to get started.


Attaching package: 'MSnbase'

The following object is masked from 'package:stats':

    smooth

The following object is masked from 'package:base':

    trimws

> png(filename="/home/ddbj/snapshot/RGM3/R_BC/result/MSnbase/plot2d-methods.Rd_%03d_medium.png", width=480, height=480)
> ### Name: plot2d-methods
> ### Title: The 'plot2d' method for 'MSnExp' quality assessment
> ### Aliases: plot2d-methods plot2d,MSnExp-method plot2d,data.frame-method
> ###   plot2d
> ### Keywords: methods
>
> ### ** Examples
>
> itraqdata
Object of class "MSnExp"
 Object size in memory: 1.88 Mb
- - - Spectra data - - -
 MS level(s): 2
 Number of MS1 acquisitions: 1
 Number of MSn scans: 55
 Number of precursor ions: 55
 55 unique MZs
 Precursor MZ's: 401.74 - 1236.1
 MSn M/Z range: 100 2069.27
 MSn retention times: 19:9 - 50:18 minutes
- - - Processing information - - -
Data loaded: Wed May 11 18:54:39 2011
 MSnbase version: 1.1.22
- - - Meta data  - - -
phenoData
  rowNames: 1
  varLabels: sampleNames sampleNumbers
  varMetadata: labelDescription
Loaded from:
  dummyiTRAQ.mzXML
protocolData: none
featureData
  featureNames: X1 X10 ... X9 (55 total)
  fvarLabels: spectrum ProteinAccession ProteinDescription
    PeptideSequence
  fvarMetadata: labelDescription
experimentData: use 'experimentData(object)'
> plot2d(itraqdata,z="ionCount")
> plot2d(itraqdata,z="peaks.count")
> plot2d(itraqdata,z="charge")
>
>
>
>
>
> dev.off()
null device
          1
>
|