Supported by Dr. Osamu Ogasawara and  . . |
|
Last data update: 2014.03.03 |
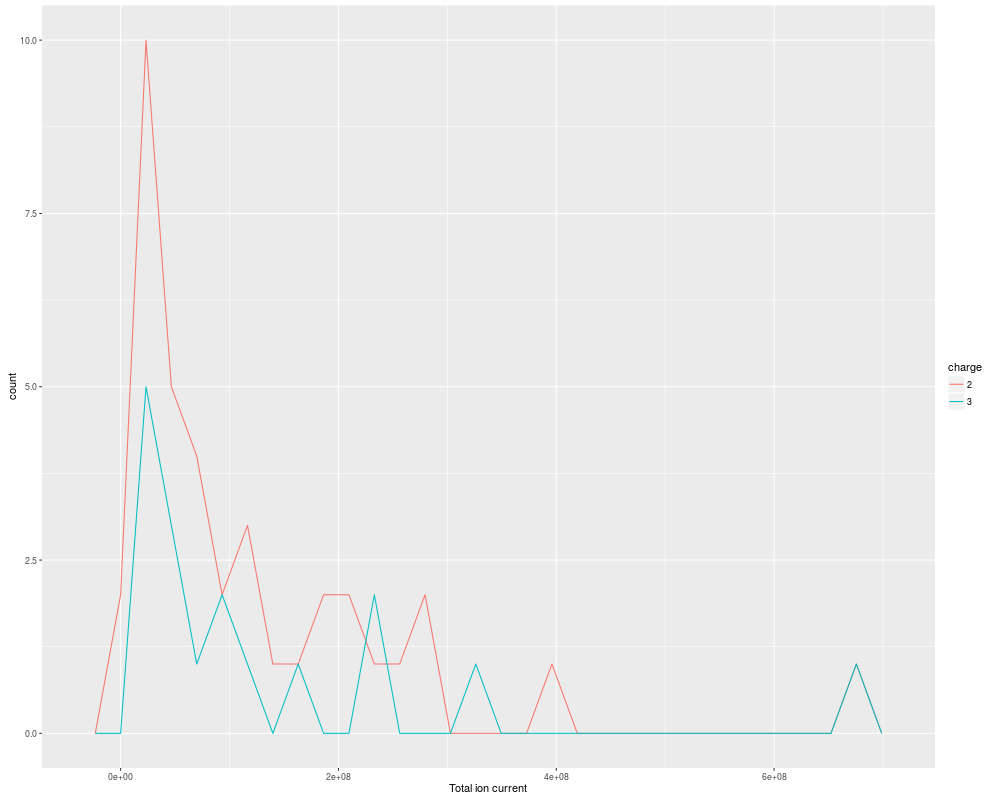
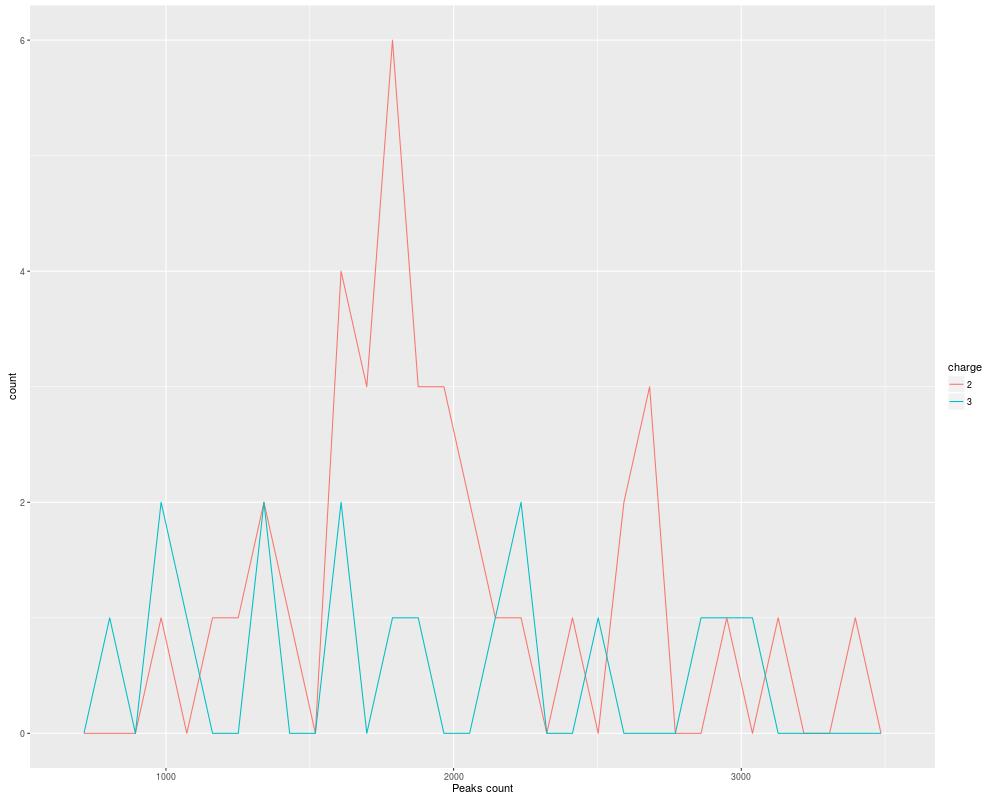
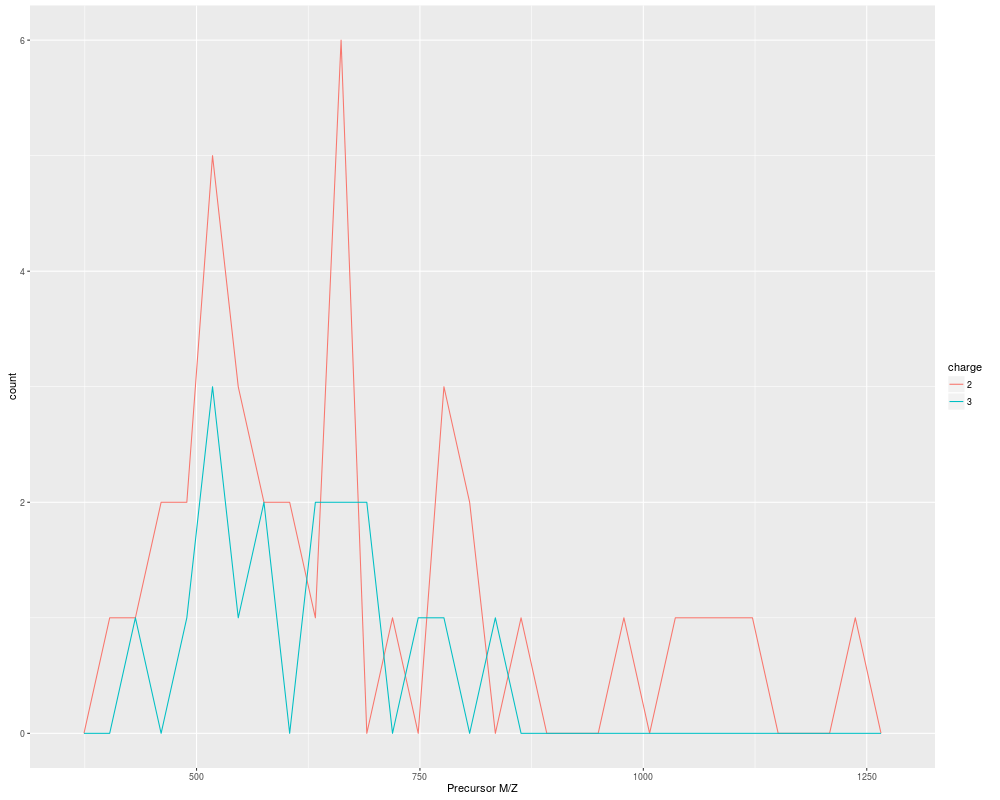
The 'plotDensity' method for 'MSnExp' quality assessmentDescriptionThese methods plot the distribution of several parameters of interest
for the different precursor charges for The methods make use the Arguments
Methods
Author(s)Laurent Gatto <lg390@cam.ac.uk> See AlsoThe Examplesitraqdata plotDensity(itraqdata,z="ionCount") plotDensity(itraqdata,z="peaks.count") plotDensity(itraqdata,z="precursor.mz") Results
R version 3.3.1 (2016-06-21) -- "Bug in Your Hair"
Copyright (C) 2016 The R Foundation for Statistical Computing
Platform: x86_64-pc-linux-gnu (64-bit)

R is free software and comes with ABSOLUTELY NO WARRANTY.
You are welcome to redistribute it under certain conditions.
Type 'license()' or 'licence()' for distribution details.

R is a collaborative project with many contributors.
Type 'contributors()' for more information and
'citation()' on how to cite R or R packages in publications.

Type 'demo()' for some demos, 'help()' for on-line help, or
'help.start()' for an HTML browser interface to help.
Type 'q()' to quit R.

> library(MSnbase)
Loading required package: BiocGenerics
Loading required package: parallel

Attaching package: 'BiocGenerics'

The following objects are masked from 'package:parallel':

    clusterApply, clusterApplyLB, clusterCall, clusterEvalQ,
    clusterExport, clusterMap, parApply, parCapply, parLapply,
    parLapplyLB, parRapply, parSapply, parSapplyLB

The following objects are masked from 'package:stats':

    IQR, mad, xtabs

The following objects are masked from 'package:base':

    Filter, Find, Map, Position, Reduce, anyDuplicated, append,
    as.data.frame, cbind, colnames, do.call, duplicated, eval, evalq,
    get, grep, grepl, intersect, is.unsorted, lapply, lengths, mapply,
    match, mget, order, paste, pmax, pmax.int, pmin, pmin.int, rank,
    rbind, rownames, sapply, setdiff, sort, table, tapply, union,
    unique, unsplit

Loading required package: Biobase
Welcome to Bioconductor

    Vignettes contain introductory material; view with
    'browseVignettes()'. To cite Bioconductor, see
    'citation("Biobase")', and for packages 'citation("pkgname")'.

Loading required package: mzR
Loading required package: Rcpp
Loading required package: BiocParallel
Loading required package: ProtGenerics

This is MSnbase version 1.20.7
  Read '?MSnbase' and references therein for information
  about the package and how to get started.


Attaching package: 'MSnbase'

The following object is masked from 'package:stats':

    smooth

The following object is masked from 'package:base':

    trimws

> png(filename="/home/ddbj/snapshot/RGM3/R_BC/result/MSnbase/plotDensity-methods.Rd_%03d_medium.png", width=480, height=480)
> ### Name: plotDensity-methods
> ### Title: The 'plotDensity' method for 'MSnExp' quality assessment
> ### Aliases: plotDensity-methods plotDensity,MSnExp-method
> ###   plotDensity,data.frame-method plotDensity
> ### Keywords: methods
>
> ### ** Examples
>
> itraqdata
Object of class "MSnExp"
 Object size in memory: 1.88 Mb
- - - Spectra data - - -
 MS level(s): 2
 Number of MS1 acquisitions: 1
 Number of MSn scans: 55
 Number of precursor ions: 55
 55 unique MZs
 Precursor MZ's: 401.74 - 1236.1
 MSn M/Z range: 100 2069.27
 MSn retention times: 19:9 - 50:18 minutes
- - - Processing information - - -
Data loaded: Wed May 11 18:54:39 2011
 MSnbase version: 1.1.22
- - - Meta data  - - -
phenoData
  rowNames: 1
  varLabels: sampleNames sampleNumbers
  varMetadata: labelDescription
Loaded from:
  dummyiTRAQ.mzXML
protocolData: none
featureData
  featureNames: X1 X10 ... X9 (55 total)
  fvarLabels: spectrum ProteinAccession ProteinDescription
    PeptideSequence
  fvarMetadata: labelDescription
experimentData: use 'experimentData(object)'
> plotDensity(itraqdata,z="ionCount")
`stat_bin()` using `bins = 30`. Pick better value with `binwidth`.
> plotDensity(itraqdata,z="peaks.count")
`stat_bin()` using `bins = 30`. Pick better value with `binwidth`.
> plotDensity(itraqdata,z="precursor.mz")
`stat_bin()` using `bins = 30`. Pick better value with `binwidth`.
>
>
>
>
>
> dev.off()
null device
          1
>
|