Supported by Dr. Osamu Ogasawara and  . . |
|
Last data update: 2014.03.03 |
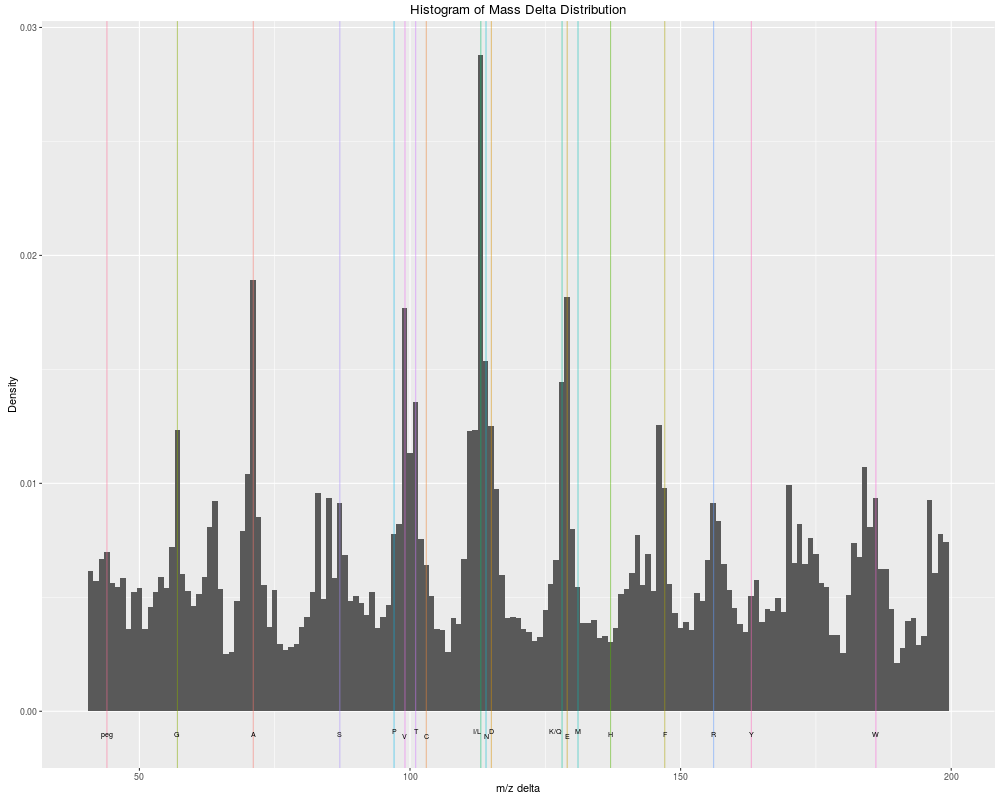
The delta m/z plotDescriptionThe m/z delta plot illustrates the suitability of MS2 spectra for identification by plotting the m/z differences of the most intense peaks. The resulting histogram should optimally shown outstanding bars at amino acid residu masses. The plots have been described in Foster et al 2011. Only a certain percentage of most intense MS2 peaks are taken into
account to use the most significant signal. Default value is 10% (see
In addition to the processing described above, isobaric reporter tag
peaks (see the Note that figures in Foster et al 2011 have been produced and optimised for centroided data. Application of the plot as is for data in profile mode has not been tested thoroughly, although the example below suggest that it might work. The methods make use the Most of the code for plotMzDelta has kindly been contributed by Guangchuang Yu. Arguments
Methods
Author(s)Laurent Gatto <lg390@cam.ac.uk> ReferencesFoster JM, Degroeve S, Gatto L, Visser M, Wang R, Griss J, Apweiler R, Martens L. "A posteriori quality control for the curation and reuse of public proteomics data." Proteomics, 2011 Jun;11(11):2182-94. doi:10.1002/pmic.201000602. Epub 2011 May 2. PMID: 21538885 See AlsoThe Examples
mzdplot <- plotMzDelta(itraqdata,
                       subset = 0.5,
                       reporters = iTRAQ4,
                       verbose = FALSE, plot = FALSE)
## let's retrieve peptide sequence information
## and get a table of amino acids
peps <- as.character(fData(itraqdata)$PeptideSequence)
aas <- unlist(strsplit(peps,""))
## table of aas
table(aas)
## mzDelta plot
print(mzdplot)
Results
R version 3.3.1 (2016-06-21) -- "Bug in Your Hair"
Copyright (C) 2016 The R Foundation for Statistical Computing
Platform: x86_64-pc-linux-gnu (64-bit)

R is free software and comes with ABSOLUTELY NO WARRANTY.
You are welcome to redistribute it under certain conditions.
Type 'license()' or 'licence()' for distribution details.

R is a collaborative project with many contributors.
Type 'contributors()' for more information and
'citation()' on how to cite R or R packages in publications.

Type 'demo()' for some demos, 'help()' for on-line help, or
'help.start()' for an HTML browser interface to help.
Type 'q()' to quit R.

> library(MSnbase)
Loading required package: BiocGenerics
Loading required package: parallel

Attaching package: 'BiocGenerics'

The following objects are masked from 'package:parallel':

    clusterApply, clusterApplyLB, clusterCall, clusterEvalQ,
    clusterExport, clusterMap, parApply, parCapply, parLapply,
    parLapplyLB, parRapply, parSapply, parSapplyLB

The following objects are masked from 'package:stats':

    IQR, mad, xtabs

The following objects are masked from 'package:base':

    Filter, Find, Map, Position, Reduce, anyDuplicated, append,
    as.data.frame, cbind, colnames, do.call, duplicated, eval, evalq,
    get, grep, grepl, intersect, is.unsorted, lapply, lengths, mapply,
    match, mget, order, paste, pmax, pmax.int, pmin, pmin.int, rank,
    rbind, rownames, sapply, setdiff, sort, table, tapply, union,
    unique, unsplit

Loading required package: Biobase
Welcome to Bioconductor

    Vignettes contain introductory material; view with
    'browseVignettes()'. To cite Bioconductor, see
    'citation("Biobase")', and for packages 'citation("pkgname")'.

Loading required package: mzR
Loading required package: Rcpp
Loading required package: BiocParallel
Loading required package: ProtGenerics

This is MSnbase version 1.20.7
  Read '?MSnbase' and references therein for information
  about the package and how to get started.


Attaching package: 'MSnbase'

The following object is masked from 'package:stats':

    smooth

The following object is masked from 'package:base':

    trimws

> png(filename="/home/ddbj/snapshot/RGM3/R_BC/result/MSnbase/plotMzDelta-methods.Rd_%03d_medium.png", width=480, height=480)
> ### Name: plotMzDelta-methods
> ### Title: The delta m/z plot
> ### Aliases: plotMzDelta-methods plotMzDelta,MSnExp-method
> ###   plotMzDelta,mzRramp-method plotMzDelta
> ### Keywords: methods
>
> ### ** Examples
>
> mzdplot <- plotMzDelta(itraqdata,
+                        subset = 0.5,
+                        reporters = iTRAQ4,
+                        verbose = FALSE, plot = FALSE)
> ## let's retrieve peptide sequence information
> ## and get a table of amino acids
> peps <- as.character(fData(itraqdata)$PeptideSequence)
> aas <- unlist(strsplit(peps,""))
> ## table of aas
> table(aas)
aas
 A  C  D  E  F  G  H  I  K  L  M  N  P  Q  R  S  T  V  W  Y
70  1 53 49 12 53  6 32 41 63 16 26 20 29 14 36 47 58  3 13
> ## mzDelta plot
> print(mzdplot)
Warning messages:
1: Removed 2 rows containing missing values (geom_vline).
2: Removed 2 rows containing missing values (geom_text).
>
>
>
>
>
> dev.off()
null device
          1
>
|