Supported by Dr. Osamu Ogasawara and  . . |
|
Last data update: 2014.03.03 |
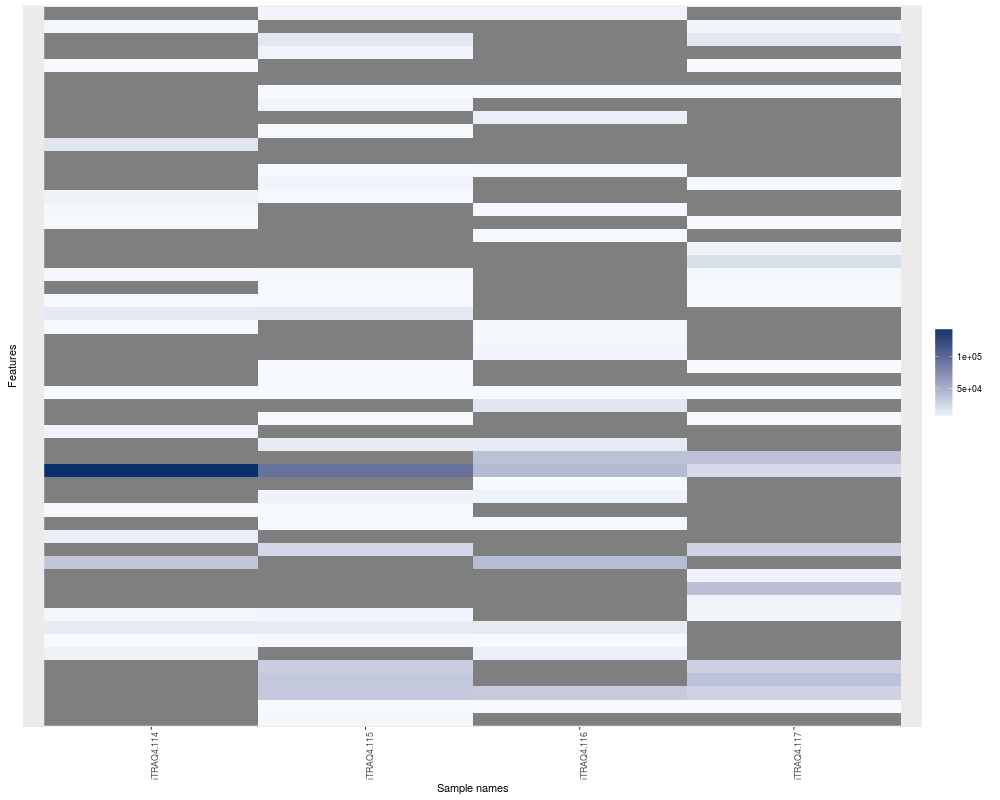
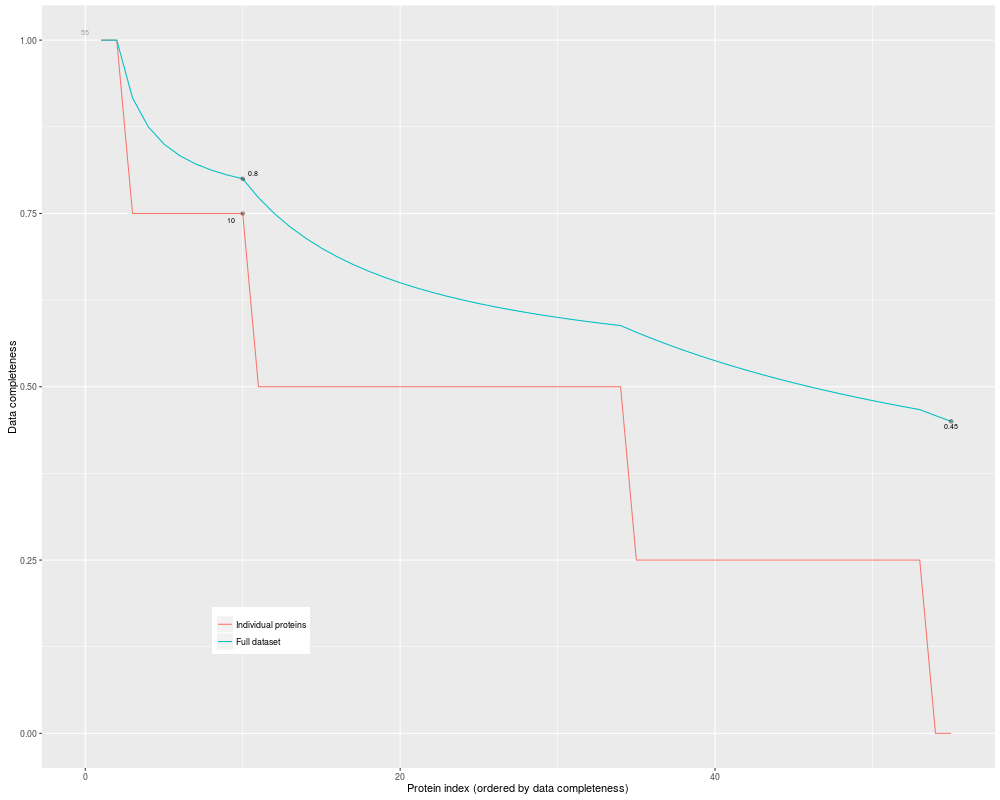
Exploring missing data in 'MSnSet' instancesDescriptionThese methods produce plots that illustrate missing data.
The Methods
Returns the a matrix of logicals of dimensions
Plots missing data for an Author(s)Laurent Gatto <lg390@cam.ac.uk> See AlsoSee also the Examplesdata(msnset) exprs(msnset)[sample(prod(dim(msnset)), 120)] <- NA head(is.na(msnset)) table(is.na(msnset)) image(msnset) plotNA(msnset, pNA = 1/4) Results
R version 3.3.1 (2016-06-21) -- "Bug in Your Hair"
Copyright (C) 2016 The R Foundation for Statistical Computing
Platform: x86_64-pc-linux-gnu (64-bit)

R is free software and comes with ABSOLUTELY NO WARRANTY.
You are welcome to redistribute it under certain conditions.
Type 'license()' or 'licence()' for distribution details.

R is a collaborative project with many contributors.
Type 'contributors()' for more information and
'citation()' on how to cite R or R packages in publications.

Type 'demo()' for some demos, 'help()' for on-line help, or
'help.start()' for an HTML browser interface to help.
Type 'q()' to quit R.

> library(MSnbase)
Loading required package: BiocGenerics
Loading required package: parallel

Attaching package: 'BiocGenerics'

The following objects are masked from 'package:parallel':

    clusterApply, clusterApplyLB, clusterCall, clusterEvalQ,
    clusterExport, clusterMap, parApply, parCapply, parLapply,
    parLapplyLB, parRapply, parSapply, parSapplyLB

The following objects are masked from 'package:stats':

    IQR, mad, xtabs

The following objects are masked from 'package:base':

    Filter, Find, Map, Position, Reduce, anyDuplicated, append,
    as.data.frame, cbind, colnames, do.call, duplicated, eval, evalq,
    get, grep, grepl, intersect, is.unsorted, lapply, lengths, mapply,
    match, mget, order, paste, pmax, pmax.int, pmin, pmin.int, rank,
    rbind, rownames, sapply, setdiff, sort, table, tapply, union,
    unique, unsplit

Loading required package: Biobase
Welcome to Bioconductor

    Vignettes contain introductory material; view with
    'browseVignettes()'. To cite Bioconductor, see
    'citation("Biobase")', and for packages 'citation("pkgname")'.

Loading required package: mzR
Loading required package: Rcpp
Loading required package: BiocParallel
Loading required package: ProtGenerics

This is MSnbase version 1.20.7
  Read '?MSnbase' and references therein for information
  about the package and how to get started.


Attaching package: 'MSnbase'

The following object is masked from 'package:stats':

    smooth

The following object is masked from 'package:base':

    trimws

> png(filename="/home/ddbj/snapshot/RGM3/R_BC/result/MSnbase/plotNA-methods.Rd_%03d_medium.png", width=480, height=480)
> ### Name: plotNA-methods
> ### Title: Exploring missing data in 'MSnSet' instances
> ### Aliases: plotNA-methods plotNA,MSnSet-method plotNA,matrix-method
> ###   plotNA is.na.MSnSet
> ### Keywords: methods
>
> ### ** Examples
>
> data(msnset)
> exprs(msnset)[sample(prod(dim(msnset)), 120)] <- NA
>
> head(is.na(msnset))
    iTRAQ4.114 iTRAQ4.115 iTRAQ4.116 iTRAQ4.117
X1       FALSE      FALSE      FALSE       TRUE
X10      FALSE       TRUE       TRUE      FALSE
X11      FALSE       TRUE       TRUE      FALSE
X12      FALSE       TRUE       TRUE       TRUE
X13      FALSE       TRUE      FALSE      FALSE
X14      FALSE       TRUE      FALSE       TRUE
> table(is.na(msnset))

FALSE  TRUE
  100   120
> image(msnset)
>
> plotNA(msnset, pNA = 1/4)
>
>
>
>
>
> dev.off()
null device
          1
>
|