Supported by Dr. Osamu Ogasawara and  . . |
|
Last data update: 2014.03.03 |
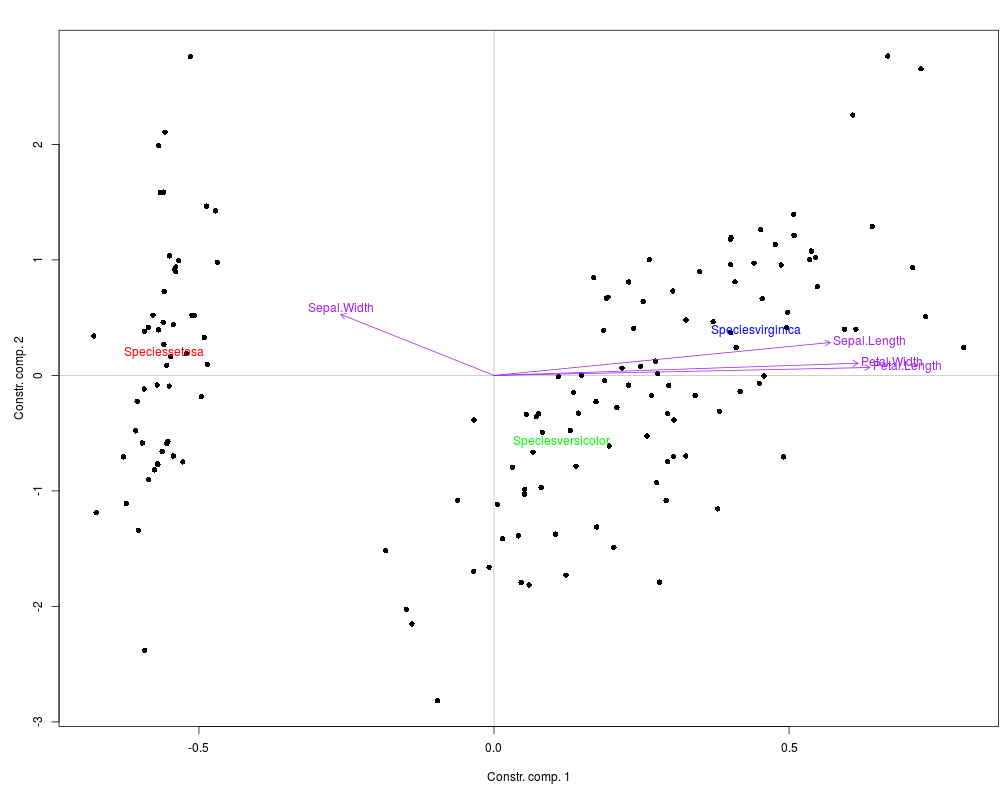
Biplot of multivariate analysesDescriptionDisplays a biplot of a multivariate analysis. This just consists in superimposing a score plot and a correlation circle (plus centroids of factor levels in constrained analyses, RDA or CCA). The correlation circle is adjusted to fit the size of the score plot. Usage
MVA.biplot(x, xax = 1, yax = 2, scaling = 2, sco.set = c(12, 1, 2),
  cor.set = c(12, 1, 2), space = 1, ratio = 0.9, weights = 1,
  constraints = c("nf", "n", "f", NULL), sco.args = list(),
  cor.args = list(), f.col = 1, f.cex = 1)
Arguments
DetailsThis function should not be use directly. Prefer the general All multivariate analyses covered by Author(s)Maxime Herv<c3><a9> <mx.herve@gmail.com> Examples
require(vegan)
data(iris)
RDA <- rda(iris[,1:4]~Species,data=iris)
MVA.plot(RDA,"biplot",cor.args=list(col="purple"),ratio=0.8,f.col=c("red","green","blue"))
Results
R version 3.3.1 (2016-06-21) -- "Bug in Your Hair"
Copyright (C) 2016 The R Foundation for Statistical Computing
Platform: x86_64-pc-linux-gnu (64-bit)

R is free software and comes with ABSOLUTELY NO WARRANTY.
You are welcome to redistribute it under certain conditions.
Type 'license()' or 'licence()' for distribution details.

R is a collaborative project with many contributors.
Type 'contributors()' for more information and
'citation()' on how to cite R or R packages in publications.

Type 'demo()' for some demos, 'help()' for on-line help, or
'help.start()' for an HTML browser interface to help.
Type 'q()' to quit R.

> library(RVAideMemoire)
*** Package RVAideMemoire v 0.9-56 ***
> png(filename="/home/ddbj/snapshot/RGM3/R_CC/result/RVAideMemoire/MVA.biplot.Rd_%03d_medium.png", width=480, height=480)
> ### Name: MVA.biplot
> ### Title: Biplot of multivariate analyses
> ### Aliases: MVA.biplot
>
> ### ** Examples
>
> require(vegan)
Loading required package: vegan
Loading required package: permute
Loading required package: lattice
This is vegan 2.4-0
> data(iris)
> RDA <- rda(iris[,1:4]~Species,data=iris)
> MVA.plot(RDA,"biplot",cor.args=list(col="purple"),ratio=0.8,f.col=c("red","green","blue"))
>
>
>
>
>
> dev.off()
null device
          1
>
|