the vertical axis. This can be set to NULL for a one-dimensional graph, which is a dotchart.
thresh
threshold (in absolute value of the correlation coefficient) of variables to be plotted.
fac
an optional factor defining groups of variables.
set
variables to be displayed, when several sets are available (see Details). 12 (default) for both sets, 1 for X or constraints, 2 for Y or constrained variables.
space
variables to be displayed, when several spaces are available (see Details). space is the number of the space to be plotted.
xlab
legend of the horizontal axis. If NULL (default), automatic labels are used depending on the multivariate analysis.
ylab
only used for two-dimensional graphs. Legend of the vertical axis. If NULL (default), automatic labels are used depending on the multivariate analysis.
main
optional title of the graph.
circle
only used for two-dimensional graphs. Logical indicating if the circle of radius 1 should be plotted.
intcircle
only used for two-dimensional graphs. Vector of one or several values indicating radii of circles to be plotted inside the main circle. Can be set to NULL.
points
only used for two-dimensional graphs. If FALSE, arrows or points (see arrows) are replaced with their corresponding label (defined by labels).
ident
only used for two-dimensional graphs when points=TRUE. A logical indicating if variable names should be displayed.
arrows
only used if points=TRUE. Logical indicating if arrows should be plotted. If FALSE, points are displayed at the extremity of the arrows.
labels
names of the variables. If NULL (default), labels correspond to variable names found in the data used in the multivariate analysis. For two-dimensional graphs, only used if ident=TRUE.
main.pos
position of the title, if main is not NULL. Default to "bottomleft".
main.cex
size of the title, if main is not NULL.
legend
only used for two-dimensional graphs. Logical indicating if a legend should be added to the graph.
legend.pos
position of the legend, if legend is TRUE. Default to "topleft".
legend.title
optional title of the legend, if legend is TRUE.
legend.lab
legend labels, if legend is TRUE. If NULL, levels of the factor defined by fac are used.
pch
symbol(s) used for points, when points are displayed (see arrows). If fac is not NULL, can be a vector of length one or a vector giving one value per group. Otherwise a vector of any length can be defined, which is recycled if necessary.
cex
size of the points and/or of the variable names. For two-dimensional graphs: if fac is not NULL, can be a vector of length one or a vector giving one value per group; otherwise a vector of any length can be defined, which is recycled if necessary. For dotcharts, gives the size used for points and all labels (see dotchart).
col
color(s) used for points and/or variable names. If fac is not NULL, can be a vector of length one or a vector giving one value per group. Otherwise a vector of any length can be defined, which is recycled if necessary (not available for density histograms, see dhist).
lwd
only used if arrows are displayed. Width of arrows. If fac is not NULL, can be a vector of length one or a vector giving one value per group. Otherwise a vector of any length can be defined, which is recycled if necessary.
drawintaxes
logical indicating if internal axes should be drawn.
add
only used for two-dimensional graphs. Logical indicating if the correlation circle should be added to an existing graph.
add.const
only used for two-dimensional graphs and if add is TRUE. Constant by which correlations are multiplied to fit onto the original graph.
keepmar
only used for two-dimensional graphs. Logical indicating if margins defined by MVA.corplot should be kept after plotting (necessary in some cases when add=TRUE).
Details
This function should not be use directly. Prefer the general MVA.plot, to which all arguments can be passed.
Many multivariate analyses are supported, from various packages:
- PCA: dudi.pca, rda.
- sPCA: spca.
- IPCA: ipca.
- sIPCA: sipca.
- LDA: lda, discrimin.
- PLS-DA (PLS2 on a dummy-coded factor): plsda. X space only.
- sPLS-DA (sPLS2 on a dummy-coded factor): splsda. X space only.
- Multilevel (s)PLS-DA ((s)PLS-DA on a dummy-coded factor): multilevel. X space only. Package 'mixOmics' version >= 5.0.4.
- CPPLS: mvr. Set 1 is X, set 2 is Y. If set=12 (default), fac is not available and pch,cex, col, lwd can be defined differently for each set. X space only.
- PLSR: mvr, pls, plsR. Set 1 is X, set 2 is Y. If set=12 (default), fac is not available and pch,cex, col, lwd can be defined differently for each set. X space only.
- sPLSR: pls. Set 1 is X, set 2 is Y. If set=12 (default), fac is not available and pch,cex, col, lwd can be defined differently for each set. X space only.
- Multilevel (s)PLSR: multilevel. Set 1 is X, set 2 is Y. If set=12 (default), fac is not available and pch,cex, col, lwd can be defined differently for each set. X space only. Package 'mixOmics' version >= 5.0.4
- PLS-GLR: plsRglm. Set 1 is X, set 2 is Y. If set=12 (default), fac is not available and pch,cex, col, lwd can be defined differently for each set. Correlations are computed with Y on the link scale.
- PCR: mvr. Set 1 is X, set 2 is Y. If set=12 (default), fac is not available and pch,cex, col, lwd can be defined differently for each set.
- CDA: discrimin, discrimin.coa.
- NSCOA: dudi.nsc. For NSCOA there is no real correlation, but the classical representation of columns is arrows. This is why MVA.corplot was made able to deal with this analysis.
- CCA: cca, cca. Constraints (only quantitative constraints are extracted) in constrained space only.
- Mix analysis: dudi.mix, dudi.hillsmith. Only quantitative variables are displayed.
- RDA (or PCAIV): pcaiv, pcaivortho, rda. With rda, space 1 is constrained space, space 2 is unconstrained space. Only constrained space is available with pcaiv, the opposite for pcaivortho. Set 1 is constraints (only quantitative constraints are extracted), set 2 is dependent variables (only set 2 is available for pcaivortho). If set=12 (default), fac is not available and pch,cex, col, lwd can be defined differently for each set.
- CCorA: CCorA, rcc. Space 1 is X, space 2 is Y. With rcc a third space is available, in which coordinates are means of X and Y coordinates. In this third space, set 1 is X, set 2 is Y. If set=12 (default), fac is not available and pch,cex, col, lwd can be defined differently for each set.
- rCCorA: rcc. Space 1 is X, space 2 is Y, space 3 is a "common" space in which coordinates are means of X and Y coordinates. In space 3, set 1 is X and set 2 is Y. If set=12 (default), fac is not available and pch,cex, col, lwd can be defined differently for each set.
- CIA: coinertia. Space 1 is X, space 2 is Y, space 3 is a "common" space where X and Y scores are normed. In space 3, set 1 is X and set 2 is Y. If set=12 in space 3 (default), fac is not available and pch,cex, col, lws can be defined differently for each set.
- 2B-PLS: pls. Space 1 is X, space 2 is Y, space 3 is a "common" space in which coordinates are means of X and Y coordinates. In space 3, set 1 is X and set 2 is Y. If set=12 (default), fac is not available and pch,cex, col, lwd can be defined differently for each set.
- 2B-sPLS: pls. Space 1 is X, space 2 is Y, space 3 is a "common" space in which coordinates are means of X and Y coordinates. In space 3, set 1 is X and set 2 is Y. If set=12 (default), fac is not available and pch,cex, col, lwd can be defined differently for each set.
- Multilevel 2B-(s)PLS: pls. Space 1 is X, space 2 is Y, space 3 is a "common" space in which coordinates are means of X and Y coordinates. In space 3, set 1 is X and set 2 is Y. If set=12 (default), fac is not available and pch,cex, col, lwd can be defined differently for each set. Package 'mixOmics' version >= 5.0.4.
- rGCCA: wrapper.rgcca. Space can be 1 to n, the number of blocks (i.e. datasets).
- sGCCA: wrapper.sgcca. Space can be 1 to n, the number of blocks (i.e. datasets).
R version 3.3.1 (2016-06-21) -- "Bug in Your Hair"
Copyright (C) 2016 The R Foundation for Statistical Computing
Platform: x86_64-pc-linux-gnu (64-bit)
R is free software and comes with ABSOLUTELY NO WARRANTY.
You are welcome to redistribute it under certain conditions.
Type 'license()' or 'licence()' for distribution details.
R is a collaborative project with many contributors.
Type 'contributors()' for more information and
'citation()' on how to cite R or R packages in publications.
Type 'demo()' for some demos, 'help()' for on-line help, or
'help.start()' for an HTML browser interface to help.
Type 'q()' to quit R.
> library(RVAideMemoire)
*** Package RVAideMemoire v 0.9-56 ***
> png(filename="/home/ddbj/snapshot/RGM3/R_CC/result/RVAideMemoire/MVA.corplot.Rd_%03d_medium.png", width=480, height=480)
> ### Name: MVA.corplot
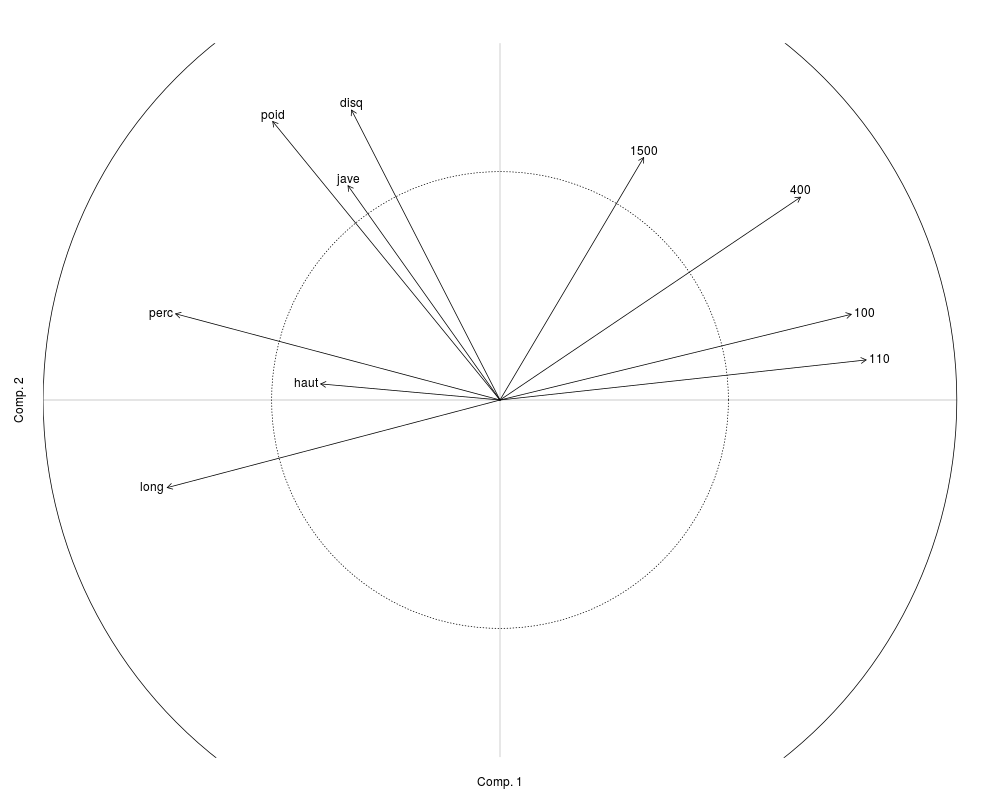
> ### Title: Correlation circle of multivariate analyses
> ### Aliases: MVA.corplot
>
> ### ** Examples
>
> require(ade4)
Loading required package: ade4
> data(olympic)
> PCA <- dudi.pca(olympic$tab,scannf=FALSE)
> MVA.plot(PCA,"corr")
>
>
>
>
>
> dev.off()
null device
1
>
 .
.