the vertical axis. This can be set to NULL for a one-dimensional graph.
fac
only used for one-dimensional graphs. An optional factor defining groups of variables.
set
variables to be displayed, when several sets are available (see Details). 12 (default) for both sets, 1 for X, 2 for Y.
space
variables to be displayed, when several spaces are available (see Details). space is the number of the space to be plotted.
map
logical indicating if a two-dimensional (TRUE, default) or a one-dimensional graph should be drawn. A one-dimensional graph can show loadings for one or two dimensions, both horizontally.
xlab
only used for two-dimensional graphs. Legend of the horizontal axis. If NULL (default), automatic labels are used depending on the multivariate analysis.
ylab
legend of the vertical axis. If NULL (default), automatic labels are used depending on the multivariate analysis.
main
optional title of the graph.
points
only used for two-dimensional graphs. If FALSE, lines or points (see links) are replaced with their corresponding label (defined by labels).
ident
logical indicating if variable names should be displayed. Only used when points=TRUE for two-dimensional graphs.
links
only used for two-dimensional graphs when points=TRUE. Logical indicating if variables should be linked to the origin of the graph. If FALSE, points are displayed at the extremity of the segments.
line
only used for one-dimensional graphs when yax=NULL. Logical indicating if loadings should be linked (default) as displayed as sticks.
labels
only used if ident=TRUE. Names of the variables. If NULL (default), labels correspond to variable names found in the data used in the multivariate analysis.
main.pos
only used for one-dimensional graphs. Position of the title, if main is not NULL. Default to "bottomleft".
main.cex
size of the title, if main is not NULL.
legend
logical indicating if a legend should be added to the graph.
legend.pos
position of the legend, if legend is TRUE. Default to "topleft".
legend.title
optional title of the legend, if legend is TRUE.
legend.lab
legend labels, if legend is TRUE. If NULL for a one-dimensional graph, dimension names are used. If NULL for a two-dimensional graph, levels of the factor defined by fac are used.
pch
only used for two-dimensional graphs. Symbol(s) used for points, when points are displayed (see links). If fac is not NULL, can be a vector of length one or a vector giving one value per group. Otherwise a vector of any length can be defined, which is recycled if necessary.
cex
size of the points and/or of the variable names. For two-dimensional graphs: if fac is not NULL, can be a vector of length one or a vector giving one value per group; otherwise a vector of any length can be defined, which is recycled if necessary.
col
color(s) used for points, variable names and/or lines/sticks. For one-dimensional graphs, can be a vector of length one or a vector giving one value per line. For two-dimensional graphs: if fac is not NULL, can be a vector of length one or a vector giving one value per group. Otherwise a vector of any length can be defined, which is recycled if necessary (not available for density histograms, see dhist).
lwd
width of lines. For one-dimensional graphs, can be a vector of length one or a vector giving one value per line. For two-dimensional graphs: if fac is not NULL, can be a vector of length one or a vector giving one value per group. Otherwise a vector of any length can be defined, which is recycled if necessary.
lty
only used for one-dimensional graphs. Can be a vector of length one or a vector giving one value per line.
drawextaxes
logical indicating if external axes should be drawn.
drawintaxes
only used for two-dimensional graphs. Logical indicating if internal axes should be drawn.
xlim
only used in two-dimensional graphs. Limits of the horizontal axis. If NULL, limits are computed automatically.
ylim
limits of the vertical axis. If NULL, limits are computed automatically.
Details
This function should not be use directly. Prefer the general MVA.plot, to which all arguments can be passed.
Many multivariate analyses are supported, from various packages:
- PCA: prcomp, princomp, dudi.pca, rda, pca, pca.
- sPCA: spca.
- IPCA: ipca.
- sIPCA: sipca.
- LDA: lda, discrimin.
- PLS-DA (PLS2 on a dummy-coded factor): plsda. X space only.
- sPLS-DA (sPLS2 on a dummy-coded factor): splsda. X space only.
- Multilevel (s)PLS-DA ((s)PLS-DA on a dummy-coded factor): multilevel. X space only. Package 'mixOmics' version >= 5.0.4.
- CPPLS: mvr. X space only.
- PLSR: mvr, pls, plsR. X space only.
- sPLSR: pls. X space only.
- Multilevel (s)PLSR: multilevel. X space only. Package 'mixOmics' version >= 5.0.4
- PLS-GLR: plsRglm.
- PCR: mvr.
- CDA: discrimin, discrimin.coa.
- NSCOA: dudi.nsc.
- MCA: dudi.acm.
- Mix analysis: dudi.mix, dudi.hillsmith.
- PCIA: procuste. Set 1 is X, set 2 is Y.
- RDA (or PCAIV): pcaiv, pcaivortho, rda. With rda, space 1 is constrained space, space 2 is unconstrained space. Only constrained space is available with pcaiv, the opposite for pcaivortho.
- CCorA: rcc. Space 1 is X, space 2 is Y.
- rCCorA: rcc. Space 1 is X, space 2 is Y.
- CIA: coinertia. Space 1 is X, space 2 is Y.
- 2B-PLS: pls. Space 1 is X, space 2 is Y.
- 2B-sPLS: pls. Space 1 is X, space 2 is Y.
- Multilevel 2B-(s)PLS: pls. Space 1 is X, space 2 is Y. Package 'mixOmics' version >= 5.0.4.
- rGCCA: wrapper.rgcca. Space can be 1 to n, the number of blocks (i.e. datasets).
- sGCCA: wrapper.sgcca. Space can be 1 to n, the number of blocks (i.e. datasets).
R version 3.3.1 (2016-06-21) -- "Bug in Your Hair"
Copyright (C) 2016 The R Foundation for Statistical Computing
Platform: x86_64-pc-linux-gnu (64-bit)
R is free software and comes with ABSOLUTELY NO WARRANTY.
You are welcome to redistribute it under certain conditions.
Type 'license()' or 'licence()' for distribution details.
R is a collaborative project with many contributors.
Type 'contributors()' for more information and
'citation()' on how to cite R or R packages in publications.
Type 'demo()' for some demos, 'help()' for on-line help, or
'help.start()' for an HTML browser interface to help.
Type 'q()' to quit R.
> library(RVAideMemoire)
*** Package RVAideMemoire v 0.9-56 ***
> png(filename="/home/ddbj/snapshot/RGM3/R_CC/result/RVAideMemoire/MVA.loadplot.Rd_%03d_medium.png", width=480, height=480)
> ### Name: MVA.loadplot
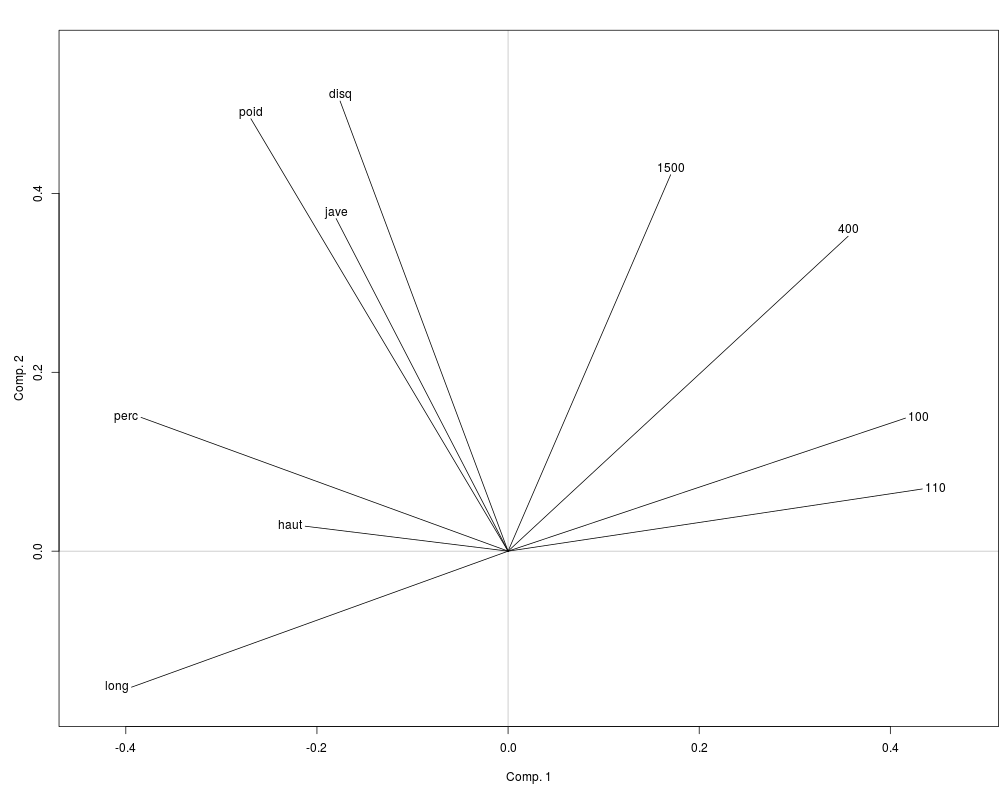
> ### Title: Loading plot of multivariate analyses
> ### Aliases: MVA.loadplot
>
> ### ** Examples
>
> require(ade4)
Loading required package: ade4
> data(olympic)
> PCA <- dudi.pca(olympic$tab,scannf=FALSE)
> MVA.plot(PCA,"load")
>
>
>
>
>
> dev.off()
null device
1
>
 .
.