the vertical axis. This can be set to NULL for a one-dimensional graph. The type of graph to be drawn in this case depends on the value of dhist.
scaling
type of scaling. Only available with some analyses performed with the vegan package. See Details.
set
scores to be displayed, when several sets are available (see Details). 12 (default) for both sets, 1 for rows or X, 2 for columns or Y.
space
scores to be displayed, when several spaces are available (see Details). space is the number of the space to be plotted.
byfac
only used with MCA and mix analyses (see Details). If TRUE, a separate score plot is displayed for each factor included in the analysis. In this case fac cannot be used and if main=NULL, the factor names are displayed as titles on the graphs.
fac
an optional factor defining groups of individuals.
barycenters
only used if fac is not NULL. If TRUE (default), the name of each group (defined by fac.lab) is diplayed at the position of the barycenter of this group. Available for two-dimensional graphs and for dotcharts in the one-dimensional case (see dhist).
stars
only used if fac is not NULL. If TRUE (default), the individual of each group are linked to their corresponding barycenter.
contours
only used if fac is not NULL. If TRUE, a polygon of contour is displayed for each group.
dhist
only used in the one-dimensional case. If TRUE (default), a density histogram is displayed. If FALSE, a dotchart is displayed.
weights
individual weights, used to calculate barycenter positions (see barycenters).
xlab
legend of the horizontal axis. If NULL (default), automatic labels are used depending on the multivariate analysis.
ylab
legend of the vertical axis. If NULL (default), automatic labels are used depending on the multivariate analysis. Available for two-dimensional graphs and for density histograms in the one-dimensional case (see dhist).
main
optional title of the graph. Can be a vector of several values for MCA and mix analyses when byfac=TRUE (see byfac).
pch
symbol(s) used for points, when points are displayed (see points). If fac is not NULL, can be a vector of length one or a vector giving one value per group. Otherwise a vector of any length can be defined, which is recycled if necessary. Available for two-dimensional graphs and for dotcharts in the one-dimensional case (see dhist). Re-used for all graphs for MCA and mix analyses when byfac=TRUE (see byfac).
cex
size of the points or of the labels (see points). Available for two-dimensional graphs and for dotcharts in the one-dimensional case (see dhist). For two-dimensional graphs: if fac is not NULL, can be a vector of length one or a vector giving one value per group; otherwise a vector of any length can be defined, which is recycled if necessary. For dotcharts, gives the size used for points and all labels (see dotchart). Re-used for all graphs for MCA and mix analyses when byfac=TRUE (see byfac).
col
color(s) used for points or labels (see points). If fac is not NULL, can be a vector of length one or a vector giving one value per group. Otherwise a vector of any length can be defined, which is recycled if necessary (not available for density histograms, see dhist). Re-used for all graphs for MCA and mix analyses when byfac=TRUE (see byfac).
points
only used for two-dimensional graphs. If FALSE, points are replaced with their corresponding label (defined by labels). Re-used for all graphs for MCA and mix analyses when byfac=TRUE (see byfac).
labels
used in two-dimensional graphs when points=FALSE and in dotcharts (see dhist). Names of the individuals. If NULL (default), labels correspond to row names of the data used in the multivariate analysis. Re-used for all graphs for MCA and mix analyses when byfac=TRUE (see byfac).
main.pos
position of the title, if main is not NULL. Default to "bottomleft". Re-used for all graphs for MCA and mix analyses when byfac=TRUE (see byfac).
main.cex
size of the title, if main is not NULL. Re-used for all graphs for MCA and mix analyses when byfac=TRUE (see byfac).
fac.lab
only used if fac is not NULL. Labels used to display barycenters in two-dimensional graphs or on the vertical axis of a dotchart in the one-dimensional case (see dhist). If NULL, levels of the factor defined by fac are used. In case of a MCA or a mix analysis with byfac=TRUE (see byfac), labels cannot be changed and correspond to the levels of the factor displayed on each graph.
fac.cex
only used if fac is not NULL and in two-dimensional graphs. Labels used to display barycenters. Can be a vector of length one or a vector giving one value per group. Re-used for all graphs for MCA and mix analyses when byfac=TRUE (see byfac).
legend
logical indicating if a legend should be added to the graph. Available for two-dimensional graphs and for density histograms in the one-dimensional case (see dhist).
legend.pos
position of the legend, if legend is TRUE. Default to "topleft".
legend.title
optional title of the legend, if legend is TRUE. Not available for MCA and mix analyses when byfac=TRUE (see byfac).
legend.lab
legend labels, if legend is TRUE. If NULL, labels defined by fac.labels are used (see fac.labels).
legend.cex
size of legend labels, if legend is TRUE.
drawextaxes
logical indicating if external axes should be drawn. Available for two-dimensional graphs and for density histograms in the one-dimensional case (see dhist).
drawintaxes
logical indicating if internal axes should be drawn.
xlim
limits of the horizontal axis. If NULL, limits are computed automatically. Re-used for all graphs for MCA and mix analyses when byfac=TRUE (see byfac).
ylim
only used in two-dimensional graphs. Limits of the vertical axis. If NULL, limits are computed automatically. Re-used for all graphs for MCA and mix analyses when byfac=TRUE (see byfac).
keepmar
only used in two-dimensional graphs. Logical indicating if margins defined by MVA.scoreplot should be kept after plotting (necessary for biplots).
Details
This function should not be use directly. Prefer the general MVA.plot, to which all arguments can be passed.
Many multivariate analyses are supported, from various packages:
- PCA: prcomp, princomp (if scores=TRUE), dudi.pca, rda, pca, pca. scaling can be defined for rda (see scores.rda).
- sPCA: spca.
- IPCA: ipca.
- sIPCA: sipca.
- PCoA: cmdscale (with at least on non-default argument), dudi.pco, wcmdscale (with at least one non-default argument), capscale, pco, pcoa.
- nMDS: monoMDS, metaMDS, nmds, isoMDS.
- LDA: lda, discrimin.
- PLS-DA (PLS2 on a dummy-coded factor): plsda. X space only.
- sPLS-DA (sPLS2 on a dummy-coded factor): splsda. X space only.
- Multilevel (s)PLS-DA ((s)PLS-DA on a dummy-coded factor): multilevel. X space only. Package 'mixOmics' version >= 5.0.4.
- CPPLS: mvr. X space only.
- PLSR: mvr, pls, plsR. X space only.
- sPLSR: pls. X space only.
- Multilevel (s)PLSR: multilevel. X space only. Package 'mixOmics' version >= 5.0.4
- PLS-GLR: plsRglm.
- PCR: mvr.
- CDA: discrimin, discrimin.coa.
- NSCOA: dudi.nsc.
- MCA: dudi.acm.
- Mix analysis: dudi.mix, dudi.hillsmith.
- COA: dudi.coa, cca. Set 1 is rows, set 2 is columns. If set=12 (default), fac is not available and pch,cex, col can be defined differently for each set. scaling can be defined for cca (see scores.cca).
- DCOA: dudi.dec. Set 1 is rows, set 2 is columns. If set=12 (default), fac is not available and pch,cex, col can be defined differently for each set.
- PCIA: procuste. Set 1 is X, set 2 is Y. If set=12 (default), fac is not available and pch,cex, col can be defined differently for each set.
- DPCoA: dpcoa. Set 1 is categories, set 2 is collections. If set=12 (default), fac is not available and pch,cex, col can be defined differently for each set.
- RDA (or PCAIV): pcaiv, pcaivortho, rda. With rda, space 1 is constrained space, space 2 is unconstrained space. Only constrained space is available with pcaiv, the opposite for pcaivortho. scaling can be defined for rda (see scores.rda).
- db-RDA (or CAP): capscale. Space 1 is constrained space, space 2 is unconstrained space.
- CCA: cca, cca. With rda, space 1 is constrained space, space 2 is unconstrained space. Only constrained space is available with cca. Set 1 is rows, set 2 is columns. scaling can be defined for cca (see scores.cca).
- CCorA: CCorA, rcc. Space 1 is X, space 2 is Y. With rcc a third space is available, in which coordinates are means of X and Y coordinates.
- rCCorA: rcc. Space 1 is X, space 2 is Y, space 3 is a "common" space in which coordinates are means of X and Y coordinates.
- CIA: coinertia. Space 1 is X, space 2 is Y, space 3 is a "common" space where X and Y scores are normed. In space 3, set 1 is X and set 2 is Y. If set=12 in space 3 (default), fac is not available and pch,cex, col can be defined differently for each set.
- 2B-PLS: pls. Space 1 is X, space 2 is Y, space 3 is a "common" space in which coordinates are means of X and Y coordinates.
- 2B-sPLS: pls. Space 1 is X, space 2 is Y, space 3 is a "common" space in which coordinates are means of X and Y coordinates.
- Multilevel 2B-(s)PLS: pls. Space 1 is X, space 2 is Y, space 3 is a "common" space in which coordinates are means of X and Y coordinates. Package 'mixOmics' version >= 5.0.4.
- rGCCA: rgcca, wrapper.rgcca. Space can be 1 to n, the number of blocks (i.e. datasets).
- sGCCA: sgcca, wrapper.sgcca. Space can be 1 to n, the number of blocks (i.e. datasets).
R version 3.3.1 (2016-06-21) -- "Bug in Your Hair"
Copyright (C) 2016 The R Foundation for Statistical Computing
Platform: x86_64-pc-linux-gnu (64-bit)
R is free software and comes with ABSOLUTELY NO WARRANTY.
You are welcome to redistribute it under certain conditions.
Type 'license()' or 'licence()' for distribution details.
R is a collaborative project with many contributors.
Type 'contributors()' for more information and
'citation()' on how to cite R or R packages in publications.
Type 'demo()' for some demos, 'help()' for on-line help, or
'help.start()' for an HTML browser interface to help.
Type 'q()' to quit R.
> library(RVAideMemoire)
*** Package RVAideMemoire v 0.9-56 ***
> png(filename="/home/ddbj/snapshot/RGM3/R_CC/result/RVAideMemoire/MVA.scoreplot.Rd_%03d_medium.png", width=480, height=480)
> ### Name: MVA.scoreplot
> ### Title: Score plot of multivariate analyses
> ### Aliases: MVA.scoreplot
>
> ### ** Examples
>
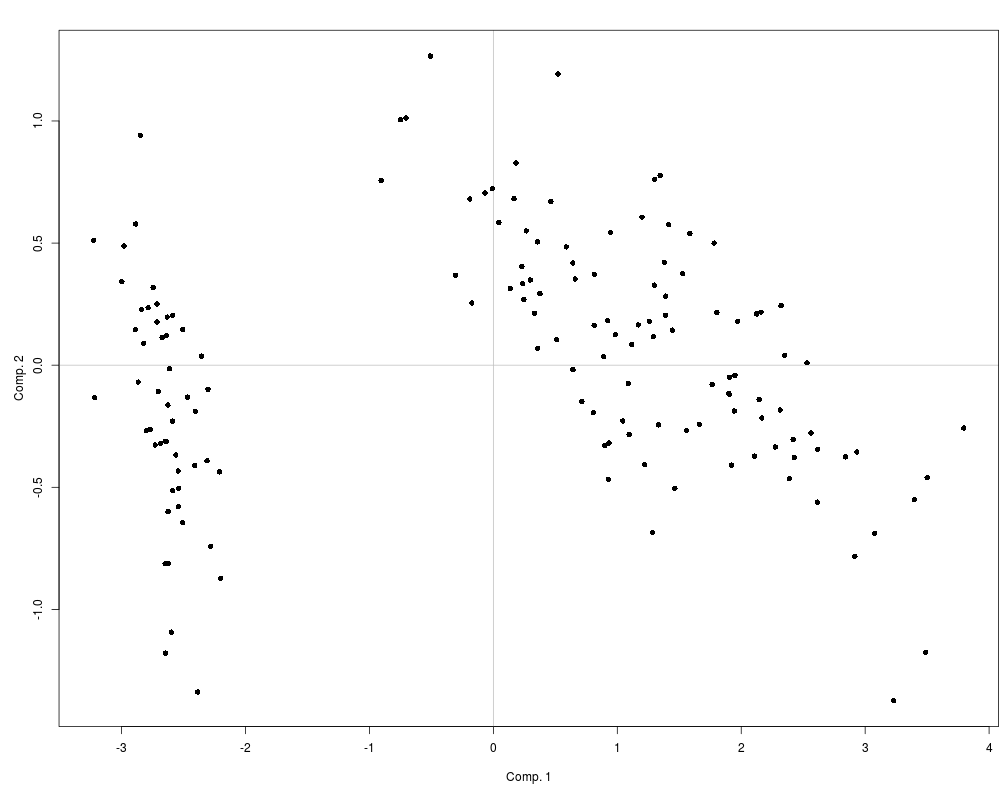
> data(iris)
> PCA <- prcomp(iris[,1:4])
> MVA.plot(PCA,"scores")
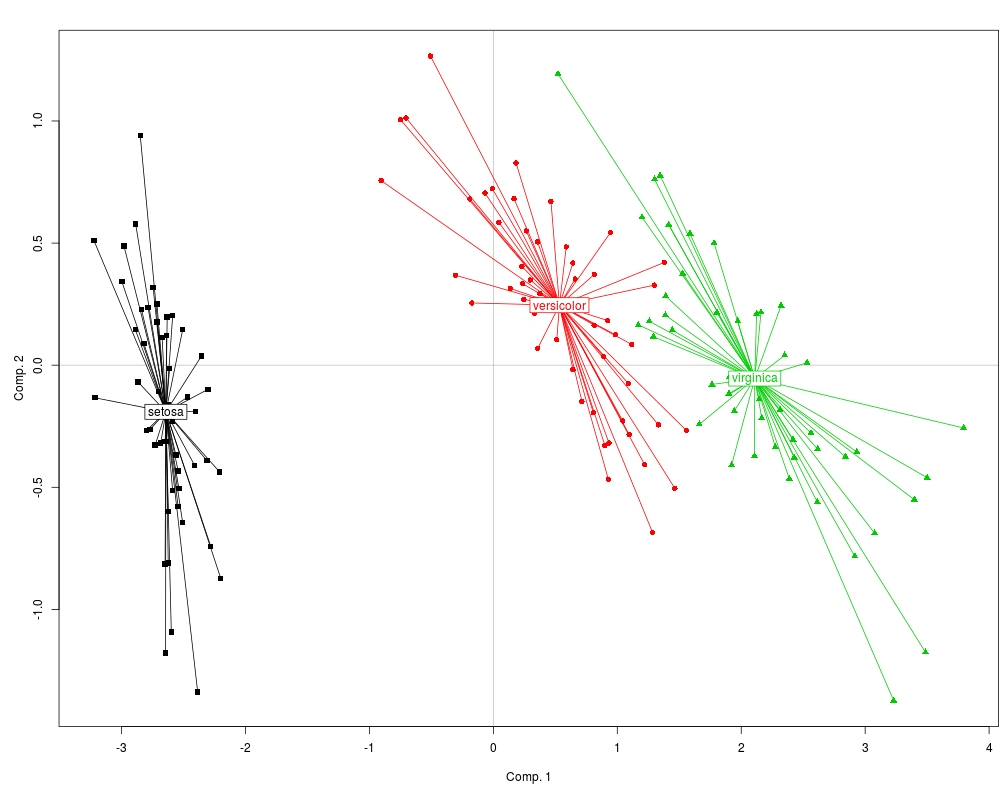
> MVA.plot(PCA,"scores",fac=iris$Species,col=1:3,pch=15:17)
>
>
>
>
>
> dev.off()
null device
1
>
 .
.