the vertical axis. Cannot be NULL, only two-dimensional graphs can be drawn.
trajects
vector or list of vectors identifying trajectories. Each vector should give the number of the individuals to be linked, ordered from the first to the last one.
trajlab
optional traject labels.
scaling
type of scaling. Only available with some analyses performed with the vegan package. See Details of MVA.scoreplot.
set
scores to be displayed, when several sets are available (see Details of MVA.scoreplot). 12 (default) for both sets, 1 for rows or X, 2 for columns or Y.
space
scores to be displayed, when several spaces are available (see Details of MVA.scoreplot). space is the number of the space to be plotted.
xlab
legend of the horizontal axis. If NULL (default), automatic labels are used depending on the multivariate analysis.
ylab
legend of the vertical axis. If NULL (default), automatic labels are used depending on the multivariate analysis.
main
optional title of the graph.
pch
symbols used for points. Can be a vector giving one value per trajectory (and a last one for non-linked points if allpoints=TRUE).
cex
size of the labels. Can be a vector giving one value per trajectory (and a last one for non-linked points if allpoints=TRUE).
trajlab.cex
size of trajectory labels. Can be a vector giving one value per trajectory.
col
color(s) used for arrows and labels. If fac is not NULL, can be a vector of length one or a vector giving one value per group. Otherwise a vector of any length can be defined, which is recycled if necessary.
lwd
width of trajectory segments. Can be a vector giving one value per trajectory.
lty
type of trajectory segments. Can be a vector giving one value per trajectory.
points
logical indicating if points should be displayed. If FALSE, points are replaced with their corresponding label (defined by labels).
allpoints
logical indicating if points which do not belong to any trajectory should be drawn.
arrows
logical indicating if trajectories should be oriented with arrows.
labels
names of the individuals. If NULL (default), labels correspond to row names of the data used in the multivariate analysis.
main.pos
position of the title, if main is not NULL. Default to "bottomleft".
main.cex
size of the title, if main is not NULL.
legend
logical indicating if a legend should be added to the graph.
legend.pos
position of the legend, if legend is TRUE. Default to "topleft".
legend.title
optional title of the legend, if legend is TRUE.
legend.lab
legend labels, if legend is TRUE. If NULL and trajlab is defined, values of trajlab are used.
legend.cex
size of legend labels, if legend is TRUE.
drawextaxes
logical indicating if external axes should be drawn..
drawintaxes
logical indicating if internal axes should be drawn.
xlim
limits of the horizontal axis. If NULL, limits are computed automatically.
ylim
limits of the vertical axis. If NULL, limits are computed automatically.
Details
This function should not be use directly. Prefer the general MVA.plot, to which all arguments can be passed.
All multivariate analyses supported by MVA.scoreplot can be used for a paired plot.
R version 3.3.1 (2016-06-21) -- "Bug in Your Hair"
Copyright (C) 2016 The R Foundation for Statistical Computing
Platform: x86_64-pc-linux-gnu (64-bit)
R is free software and comes with ABSOLUTELY NO WARRANTY.
You are welcome to redistribute it under certain conditions.
Type 'license()' or 'licence()' for distribution details.
R is a collaborative project with many contributors.
Type 'contributors()' for more information and
'citation()' on how to cite R or R packages in publications.
Type 'demo()' for some demos, 'help()' for on-line help, or
'help.start()' for an HTML browser interface to help.
Type 'q()' to quit R.
> library(RVAideMemoire)
*** Package RVAideMemoire v 0.9-56 ***
> png(filename="/home/ddbj/snapshot/RGM3/R_CC/result/RVAideMemoire/MVA.trajplot.Rd_%03d_medium.png", width=480, height=480)
> ### Name: MVA.trajplot
> ### Title: Trajectory plot of multivariate analyses
> ### Aliases: MVA.trajplot
>
> ### ** Examples
>
> require(ade4)
Loading required package: ade4
> data(olympic)
> PCA <- dudi.pca(olympic$tab,scannf=FALSE)
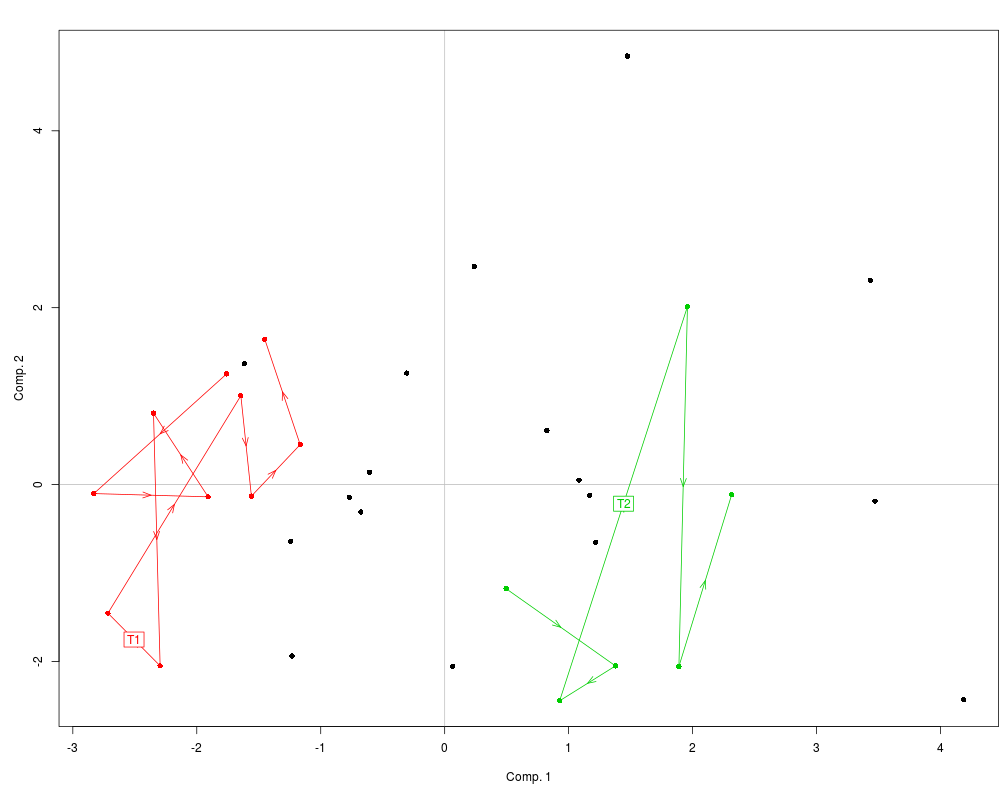
> MVA.plot(PCA,"traject",trajects=list(1:10,25:30),col=c(2,3,1),trajlab=c("T1","T2"))
>
>
>
>
>
> dev.off()
null device
1
>
 .
.