Supported by Dr. Osamu Ogasawara and  . . |
|
Last data update: 2014.03.03 |
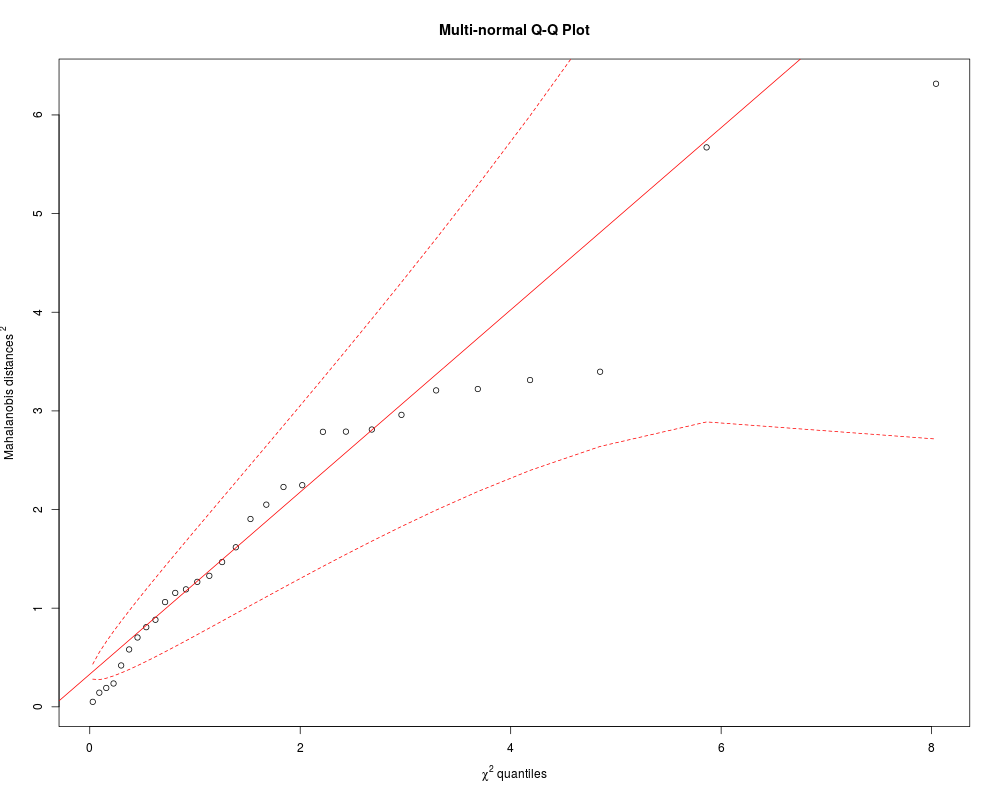
Multivariate normality QQ-PlotDescriptionDraws a QQ-plot to assess multivariate normality. Usagemqqnorm(x, main = "Multi-normal Q-Q Plot") Arguments
Author(s)Maxime Herv<c3><a9> <mx.herve@gmail.com> See Also
Examplesx <- 1:30+rnorm(30) y <- 1:30+rnorm(30,1,3) mqqnorm(cbind(x,y)) Results
R version 3.3.1 (2016-06-21) -- "Bug in Your Hair"
Copyright (C) 2016 The R Foundation for Statistical Computing
Platform: x86_64-pc-linux-gnu (64-bit)

R is free software and comes with ABSOLUTELY NO WARRANTY.
You are welcome to redistribute it under certain conditions.
Type 'license()' or 'licence()' for distribution details.

R is a collaborative project with many contributors.
Type 'contributors()' for more information and
'citation()' on how to cite R or R packages in publications.

Type 'demo()' for some demos, 'help()' for on-line help, or
'help.start()' for an HTML browser interface to help.
Type 'q()' to quit R.

> library(RVAideMemoire)
*** Package RVAideMemoire v 0.9-56 ***
> png(filename="/home/ddbj/snapshot/RGM3/R_CC/result/RVAideMemoire/mqqnorm.Rd_%03d_medium.png", width=480, height=480)
> ### Name: mqqnorm
> ### Title: Multivariate normality QQ-Plot
> ### Aliases: mqqnorm
>
> ### ** Examples
>
> x <- 1:30+rnorm(30)
> y <- 1:30+rnorm(30,1,3)
> mqqnorm(cbind(x,y))
>
>
>
>
>
> dev.off()
null device
          1
>
|
Created & Maintained by Osamu Ogasawara (osamu.ogasawara@gmail.com) and 